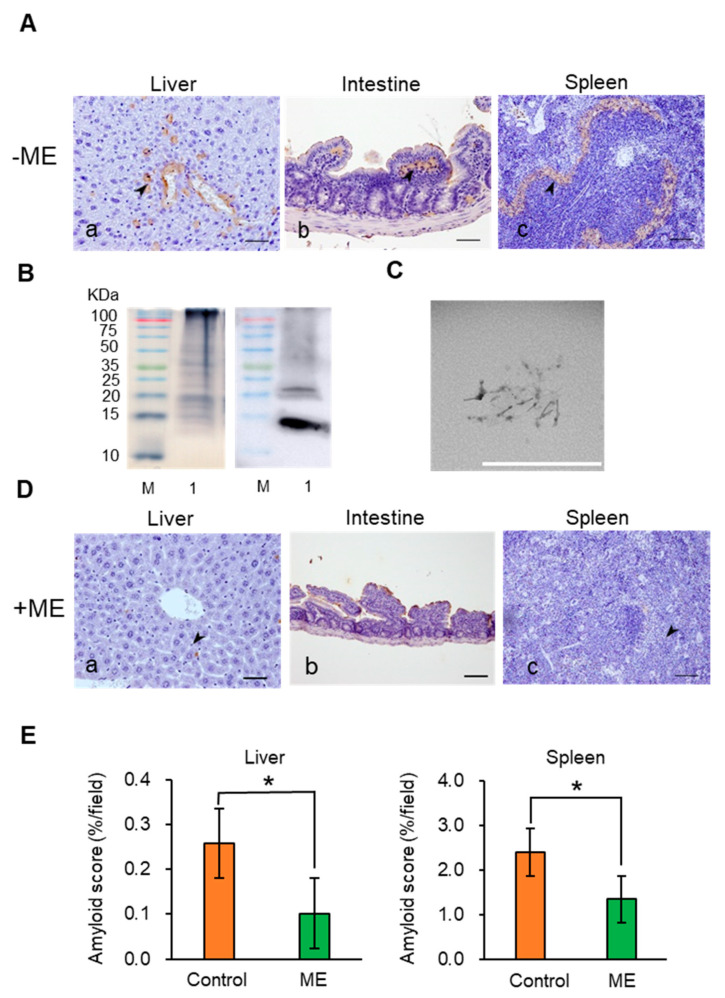
Figure 4.
Amyloid deposition in mouse organs with or without RA treatment. (A) Experimentally induced AA amyloidosis detected by IHC staining (−ME group): (a) Liver. AA deposit was observed in the central vein and in the space of Disse (arrowhead) (n = 5 separate experiments). (b) Intestine. AA deposit was observed in the lamina propria (arrowhead). (c) Spleen. AA deposit was observed adjacent to the white pulp (marginal zone) (arrowhead). Scale bars indicate 100 μm. (B) SDS-PAGE (left) and Western Blot (right) of murine AA amyloid extracts. M, molecular weight marker; Lane 1: full murine AA amyloid extracts. (C) Transmission electron microscopic observation of amyloid fibrils. Scale bar indicates 1 µm. (D) Induced AA amyloidosis of ME-treated group (+ME group) mice (IHS staining). (a) Liver. Slight AA deposit was observed (arrowhead). (b) Intestine. AA deposit was not observed. (c) Spleen. Slight AA deposit was observed (arrowhead) (n = 5 separate experiments). Scale bars indicate 100 μm. (E) Amyloid deposition analysis in liver and spleen with +ME and control group (* p < 0.05, Welch’s t-test). Each error bar represents mean ± SEM.

