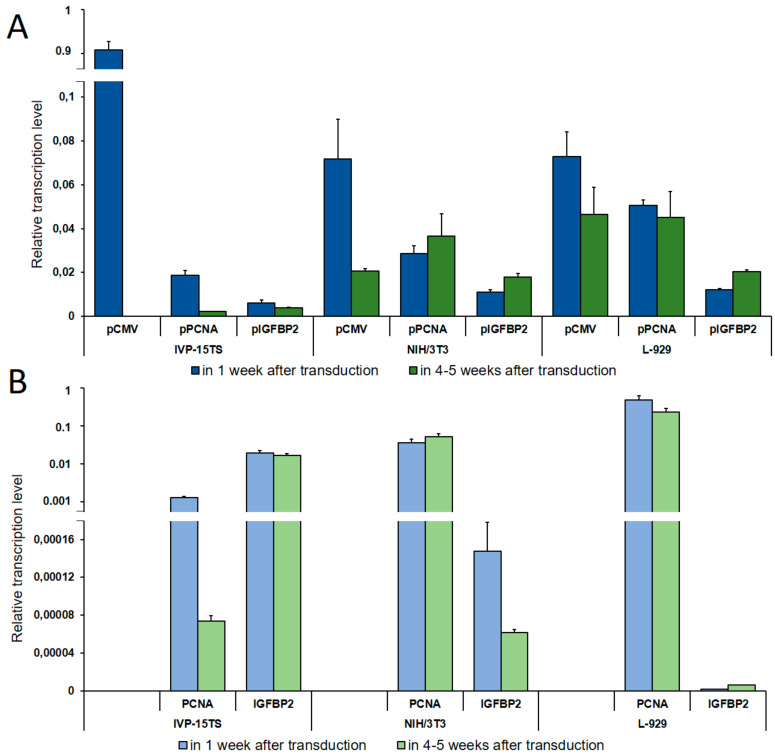
Figure 2.
Determination of Relative Transcription Level. (A) Relative transcription level of the transgene under the control of pCMV, pPCNA, and pIGFBP2 promoters as determined by qPCR analysis. (B) Relative transcription level of the PCNA and the IGFBP2 genes. The names of promoters or genes are indicated below the abscissa axis. The measurements were performed in three independent replicate experiments for each sample and are represented as mean ± s.e.m.

