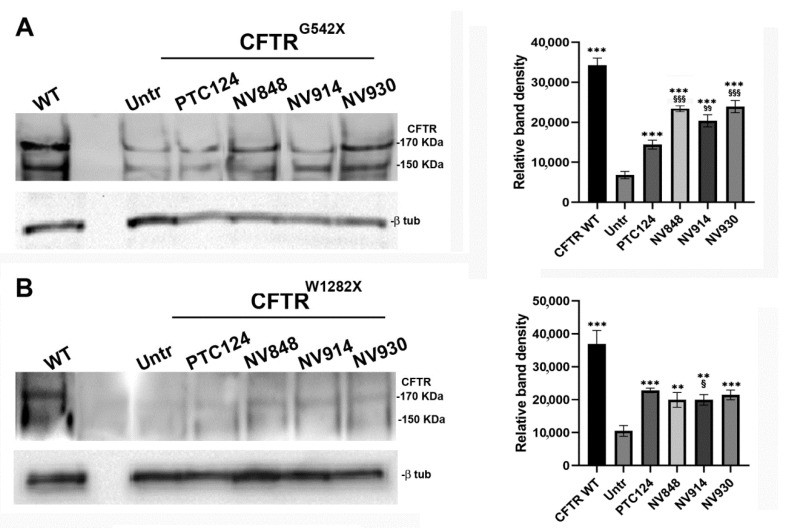
Figure 8.
Western blot analysis of the CFTR protein in wild-type (WT) CFTR, and CFTRG542X (A) and CFTRW1282X (B) FRT cells, untreated (Untr) or treated with 12 μM PTC124 (positive control), NV848, NV930, or NV914 for 24 h; β-tubulin was used as control for the protein loading. The graphs show the quantification of the gel bands by ImageJ software. The experiment was performed in triplicate and data were normalized by β-tubulin expression, analyzed by GraphPad Prism 6 software. Data are expressed as mean values ± standard error of the mean (SEM). Symbols (* and §) represent the statistical significance of NV848, NV914, and NV930 versus Untr (*) and versus PTC124 (§). two symbols, p < 0.01; three symbols, p < 0.001 (Student’s t-test and ANOVA with Dunnett’s posthoc test).

