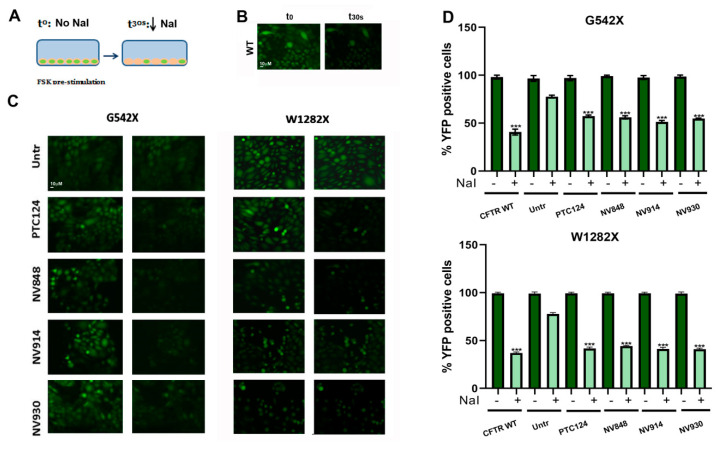
Figure 9.
CFTR functionality in FRT cells measured by the yellow fluorescent protein (YFP) assay (pink: cells, green: YFP protein expression, blue: multiwell), (A) in YFP-CFTRWT FRT, and (B) CFTRG542X and CFTRW1282X FRT cells, untreated or treated with 12 μM PTC124, NV848, NV914, or NV930 for 24 h (C). Cells were prestimulated with 20 μM forskolin for 20 min. The experiment was performed in triplicate. Images were taken before (t0) and after (t30s) the addition of NaI. Percentages of YFP-positive cells before (− dark green bars) and after NaI addition (+ light green bars); data were analyzed by GraphPad (n = 3) and expressed as mean values ± standard error of the mean (SEM) (D). Data were analyzed comparing treated FRT cells versus untreated FRT cells by GraphPad Prism 6 software (n = 3). ***, p < 0.001 (ANOVA with Dunnett’s posthoc test).

