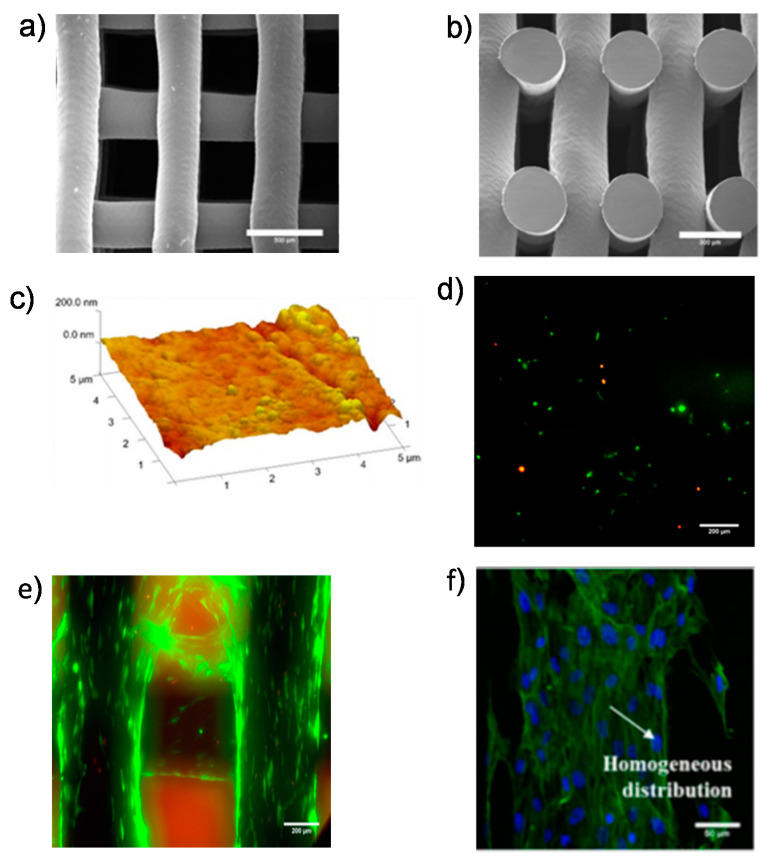
Figure 5.
(a) SEM images showing the cell morphology of the polycaprolactone (PCL)–MWCNT scaffold: (a) top-view (scale bar: 500 µm) and (b) cross-section view (scale bar: 300 µm); (c) AFM images showing the PCL–MWCNT scaffold (scale bar: 5 µm); live/dead assay at (d) day 1 (scale bar: 200 µm) and (e) day 21 for the PCL–MWCNT scaffold (scale bar: 200 µm); (f) homogeneous distribution of cells on the surface of the PCL–MWCNT scaffold (scale bar: 50 µm). Reprinted with permission from [69].

