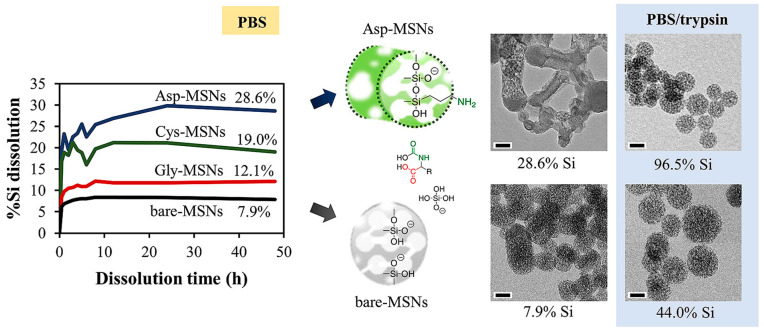
Figure 11.
Scheme showing the degradation profile by following the % Si dissolution of bare, Gly- Asp-, and Cys-MONs in PBS at pH 7.4 with the time, and corresponding TEM images in the presence of trypsin enzyme in PBS (pH 7.4) to simulate their degradation in a human system. Reproduced from [49] (https://doi.org/10.1016/j.micromeso.2019.02.033), with permission from Elsevier.

