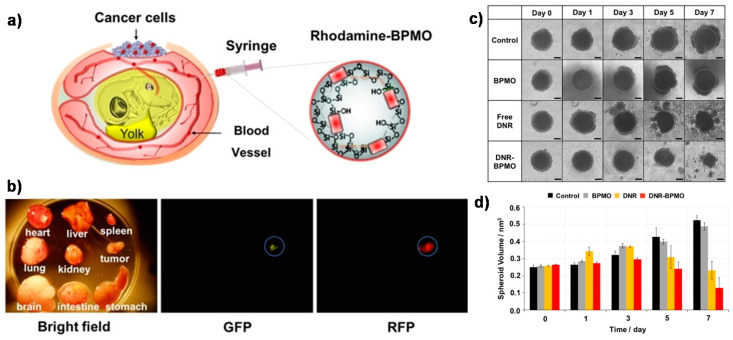
Figure 16.
Schematic illustration of (a) chicken egg tumor model injected by rhodamine B-labeled BPMO nanoparticles (0.2 mg. 100 μL−1) intravenously into chicken egg blood vessel. (b) Bright field and fluorescence images indicate the preferential accumulation of the BPMOs in the tumor, expressing green or red fluorescent protein (GFP and RFP, respectively); (c) Optical image of ovarian tumor spheroid; (d) calculated spheroid volume after treatment with no injection (Control), free BPMO nanoparticles, free daunorubicin (DNR) or DNR-BPMO nanoparticles over a period of 7 days. Scale bar: 100 μm Reproduced from [63] (https://doi.org/10.1002/cmdc.201900595) with permission from Wiley-VCH.

