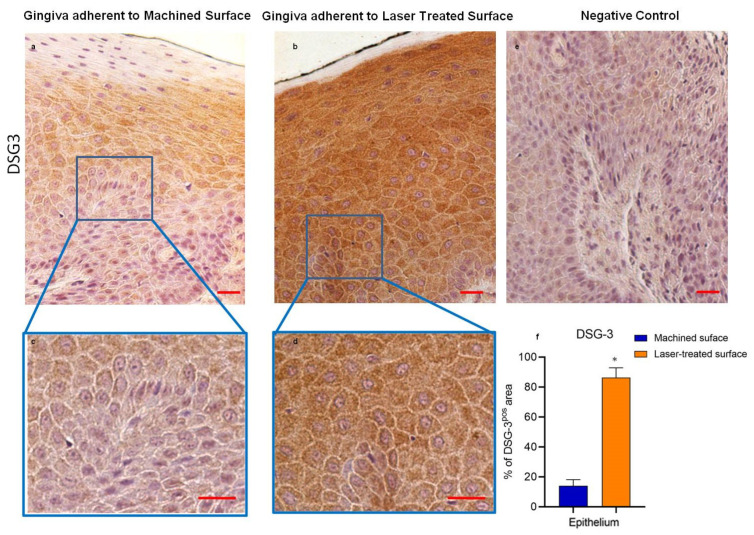
Figure 6.
Immunostaining against DSG-3 of the region of gingiva adherent to the machined surface (a,c) or the laser-treated surface (b,d), as indicated. (e) represents the negative control. Images are representative of 15 different experiments. Scale bar: 10 µm. (f) Bar graphs show the percentage of DSG-3 immunostaining positive areas in the epithelial layers, as indicated. Values are expressed as mean ± SD of five determinations in randomly chosen sections for each specimen. * indicates values statistically different (p <0.001) between the region of the gingiva adherent to the laser-treated or to machined surfaces, as indicated.

