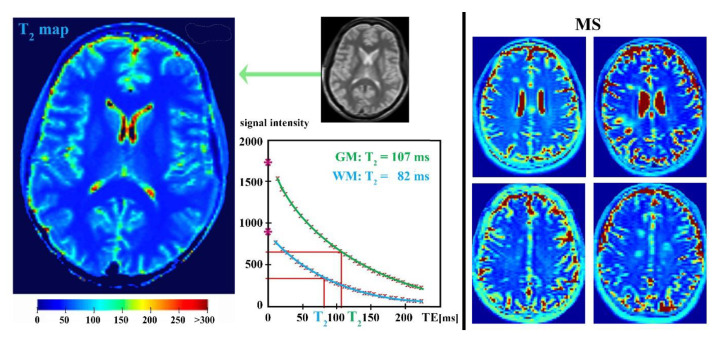
Figure 6.
Visualization of the T2 relaxation time mapping. T2 relaxation time mapping of the brain tissue showing measured relaxation signal decays (relaxation curves, blue for white matter (WM) and green for gray matter (GM)), including relaxation T2 time values for both WM and GM. The T2 parameter maps for healthy (on the left) and MS-affected (on the right) brain are also depicted.

