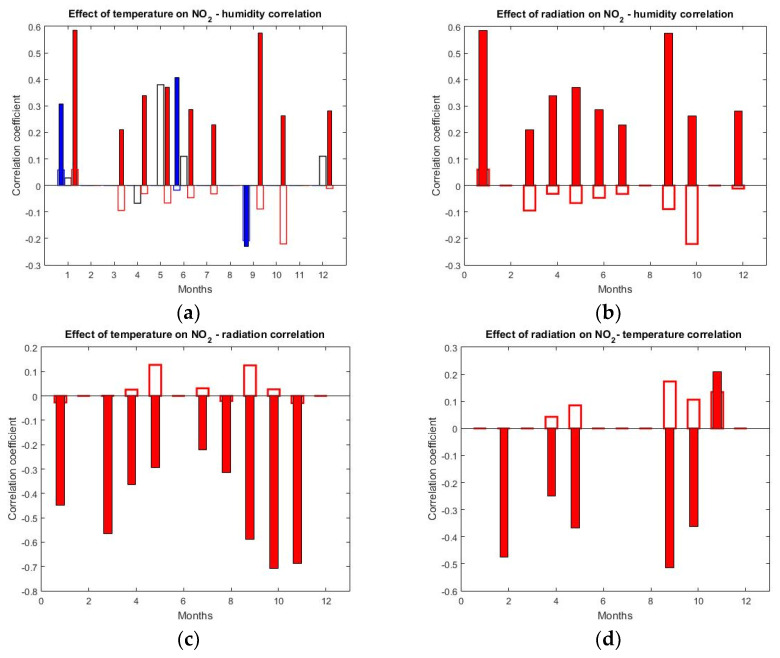
Figure 6.
Partial correlation between NO2 concentration and meteorological parameters. Full bars describe the bivariate correlation and empty bars describe the difference (D) between the partial and bivariate correlation. Correlation coefficients for the whole day are shown in black, while red/blue correspond to day/night, respectively—see text for details. Coefficients are shown for the >90% confidence level. Partial correlation between NO2 and humidity is shown in (a) (temperature constant) and (b) (radiation constant). Partial correlation between NO2 and radiation is shown in (c) (temperature constant) and the effect of radiation on the correlation with temperature is in (d).

