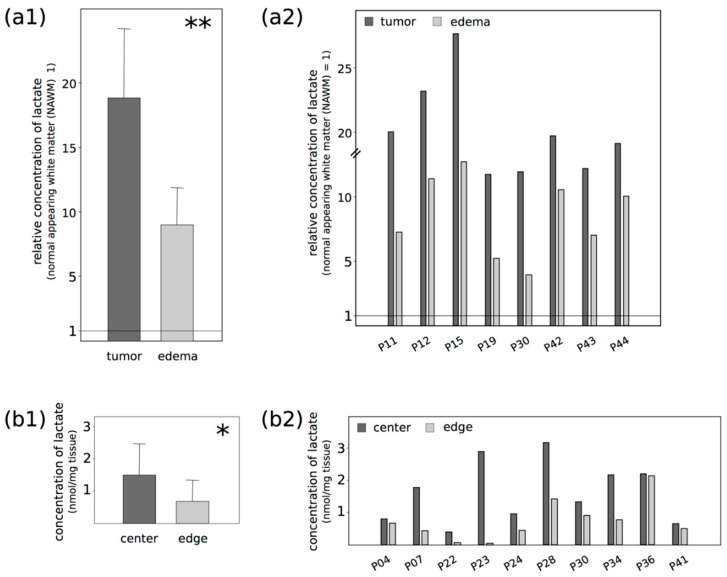
Figure 2.
Comparison of lactate concentrations in different glioblastoma regions (P: patient/probe), as evaluated by (a) multi voxel magnetic resonance spectroscopic imaging (MRSI) and (b) lactate ELISA. (a) Based on the “normal appearing white matter (NAWM)” as reference (NAWM = 1), the relative lactate concentrations are given for the contrast-enhancing part of the tumor (“tumor”)—meaning in T1-weighted images after intravenous contrast agent injection—and for the edema without contrast enhancement (“edema”); (b) The lactate concentrations were determined in paired center and edge tumor samples and given as nmol/mg tissue. Both methods revealed a significantly different concentration of lactate comparing the examined regions. The relative lactate concentrations were significantly higher in the (a) contrast-enhancing part of the tumor than in the edema or the NAWM (** p: 0.006), and at the (b) tumor center compared with the edge (* p: 0.042). Statistically significant differences were determined by (a) one-way ANOVA or (b) two-tailed Student’s t-test. (a1) and (b1) show the average values of the determined concentrations, whereas (a2) and (b2) plot the values of each probe.

