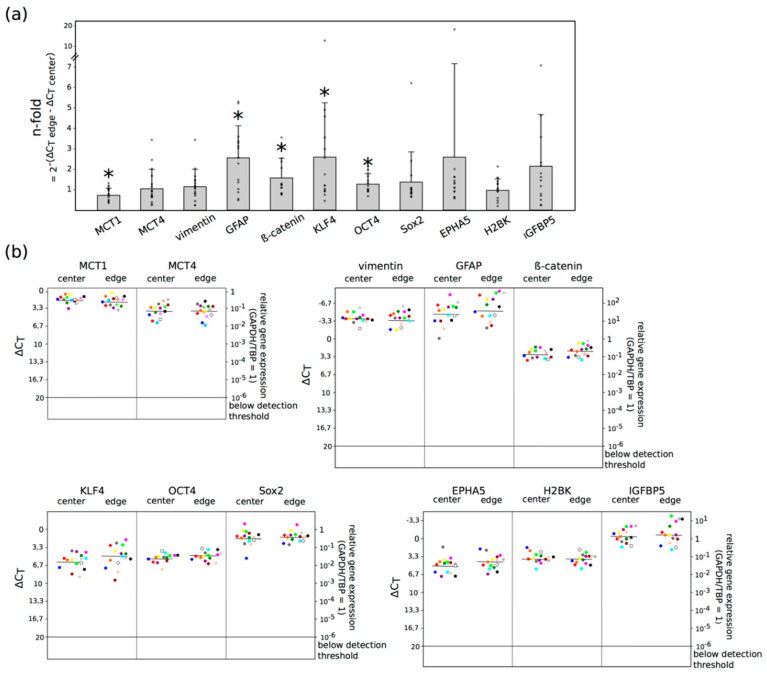
Figure 3.
Expression of MCT (monocarboxylate transporter) 1, MCT4, EMT (epithelial to mesenchymal transition) markers (vimentin, β-catenin), stem-like cell markers [KLF4 (krüppel-like factor 4), OCT4 (octamer-binding transcription factor 4), Sox2 (sex-determining region Y-box 2)], dormancy markers [EPHA5 (ephrin receptor A5), H2BK (histone cluster 1 H2B family member k), IGFBP5 (insulin-like growth factor-binding protein 5)] and GFAP (glial acidic fibrillary protein) in pairs of center and edge glioblastoma samples was evaluated by quantitative reverse transcription PCR (logarithmic scale, a ΔCt = 3.33 increase corresponds to a 10-fold decrease in gene expression). (a) Shows the n-fold changes of each marker between the center and the edge of the tumor (calculated with the average values of 2−(ΔCt edge −ΔCt center) = n-fold), small dots plot the n-fold value of each probe, whereas (b) plots the ΔCt values itself. GAPDH (glyceraldehyde-3-phosphate dehydrogenase) and TBP (TATA-box-binding protein) served as internal standards. The expression of MCT1 was significantly lower (* p: 0.025), whereas GFAP (* p: 0.010), β-catenin (* p: 0.039), KLF4 (* p: 0.035) and OCT4 (* p: 0.026) showed a significant higher expression at the edge of the tumor compared with the center, as determined by two-tailed Student’s t-test. Furthermore, a slightly increased expression (more than 2-fold) of EPHA5 and IGFBP5 was detectable at the edge of the tumor compared with the center.

