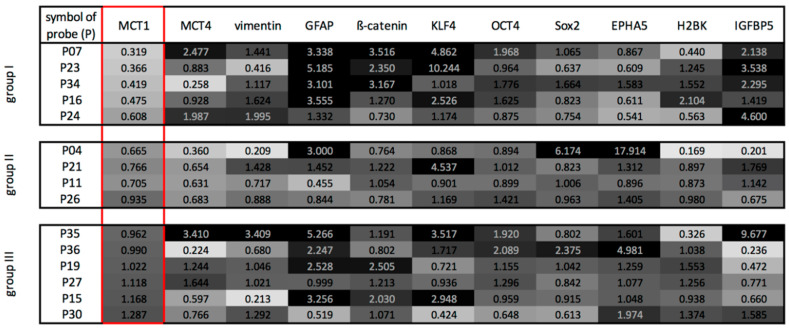
Figure 4.
Heatmap-like analysis of gene expression ratios (calculated as 2−(ΔCt cedge −ΔCt center)) between pairs of the edge and center glioblastoma samples equal expression at the edge and center pairs is assigned as 30% grey, lower expressions at the edge of the tumor is assigned an increasing lighter shading with a ratio close to 0 corresponding to white, and higher expressions at the edge of the tumor is assigned with increasing darker grey shades until 3 or higher-fold expression which is assigned as black. Mainly depending on the n-fold expression changes of MCT1, therefore outlined in red, three groups with distinct patterns of marker expression could be distinguished: group I showing a downregulation of MCT1 combined with an upregulation of GFAP and individual EMT-, stemness- and dormancy-associated markers (β-catenin, KLF4, IGFBP5) at the edge of the tumor—group II showed a slightly to moderate downregulation of MCT1 and MCT4 at the edge of the tumor, whereas the EMT-, stemness- and dormancy-associated markers were expressed heterogeneously and group III revealed a heterogenous pattern of all examined markers.

