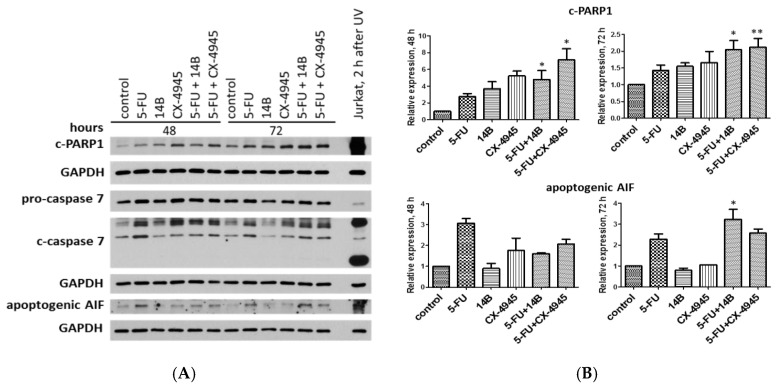
Figure 7.
Western blot analysis of cleaved PARP1 (c-PARP1), the pro-form and active form of caspase 7 (pro-caspase 7 and c-caspase 7, respectively), and the apoptogenic form of apoptosis inducing factor (AIF) in crude extracts obtained from MDA-MB-231 cells after 48 h and 72 h of treatment with 15 µM 5-FU, 2 µM 14B, and 5 µM CX-4945, used separately or in combination. GAPDH was used as a loading control for each sample. (A) The representative blots; (B) densitometry quantifications for c-PARP1 and apoptogenic AIF are shown in the graphs, with untreated cells serving as the reference point (1). * Statistically, significantly different from that of 5-FU-treated cells and the drug combinations by student’s t-test (p ≤ 0.05) (see Materials and Methods). Extract from UV-treated Jurkat cells was used as a positive control. After 2 h, one-minute UV-irradiated Jurkat leukemic T-cell line was lysed and subjected to analysis.

