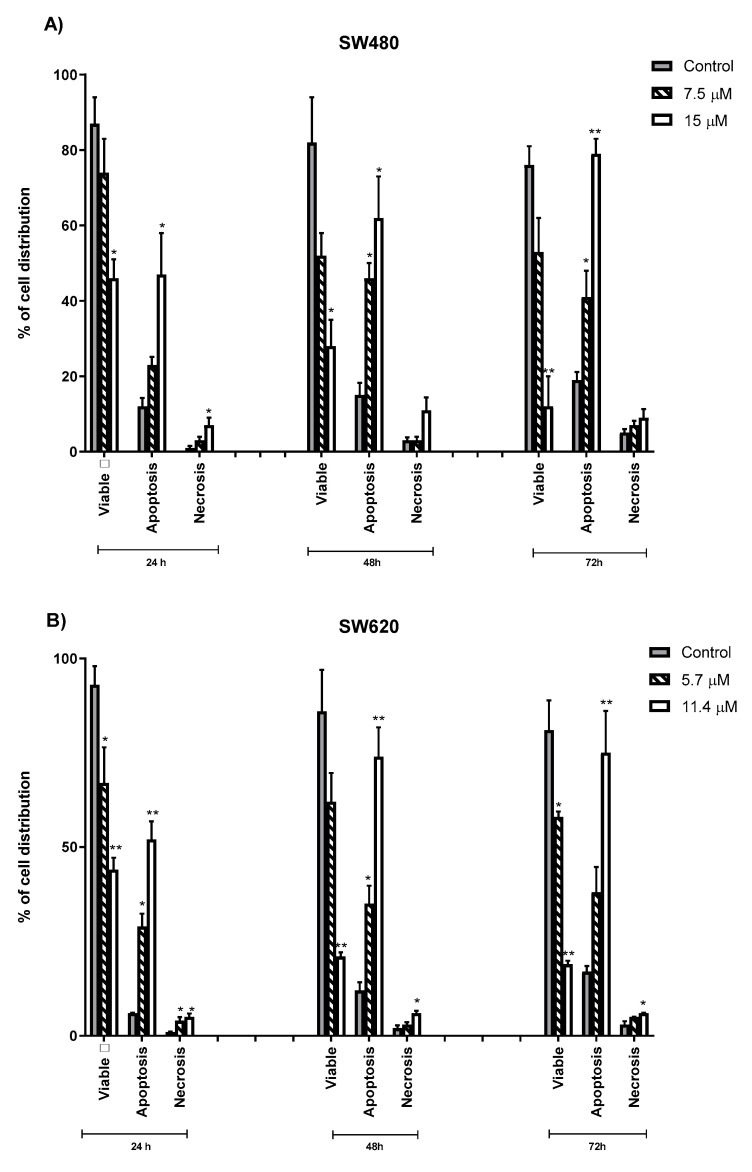
Figure 6.
Percentage of viable, apoptotic, and necrotic cells in SW480 (A) and SW620 (B) treated with MS13 for 24, 48, and 72 h. Treated and non-treated cells were double-stained with Annexin V/ Propidium Iodide and a minimum of 200 cells were counted per sample. Experiments were performed in triplicates and results were compared between two independent experiments. Comparison between data sets was performed using ANOVA. Asterisk indicates statistically significant (* for p ≤ 0.05, ** for p ≤ 0.01, *** for p ≤ 0.001 and **** for p ≤ 0.0001) differences between the means of values with treated vs untreated cells. Error bars indicate mean ± SEM.

