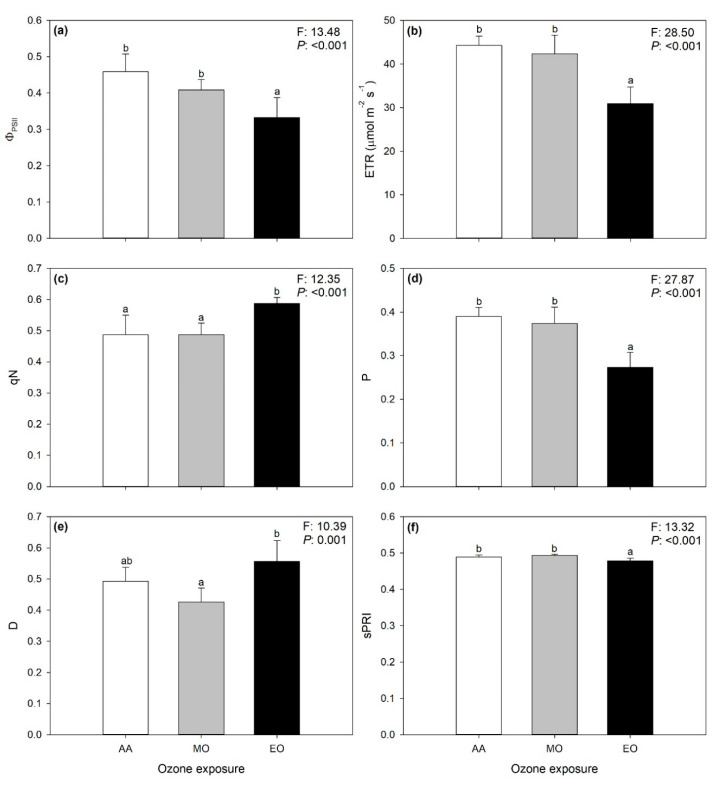
Figure 4.
Variations of PSII operating efficiency in light conditions, ΦPSII (a); ETR, electron transport rate, ETR (b); non-photochemical quenching calculated as (Fm − Fm’)/(Fm − F0′), qN (c); fraction of light absorbed in PSII antennae that is utilized in PSII photochemistry, P (d); fraction of light absorbed in PSII antennae that is dissipated thermally, D (e); and (scaled) photosynthetic reflectance index, sPRI (f) estimated from spectra collected on leaves of date palm under ambient (AA, white), moderate (MO, gray) and elevate (EO, black) ozone concentrations. Data are shown as mean ± standard deviation. F- and p-values for the effects of ozone from a one-way ANOVA are shown in the top-right corner of panels. According to Tukey’s post-hoc test, different letters indicate significant differences among means (p: ≤0.05).

