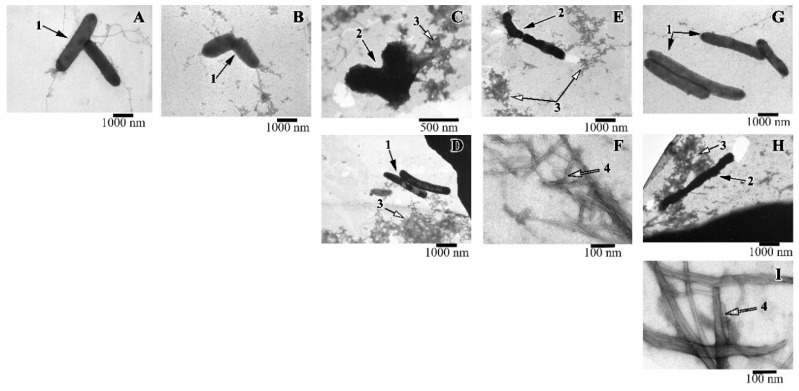
Figure 6.
Images of T. thermophilus cells after peptide treatment. (A): intact cells; (B): V10T (100 μg/mL), (C): R23I (50 μg/mL); (D): R23I (1000 μg/mL); (E,F): V10I (1000 μg/mL); (G): R23T (100 μg/mL); (H,I): R23T (500 μg/mL). Scale bar is 1000 nm for A, B, D, E, G, H; 500 nm for C and 100 nm for F, I. 1—cells with normal morphology, 2—cells with altered structure, 3—aggregates of proteins and peptides, 4—fibrils.

