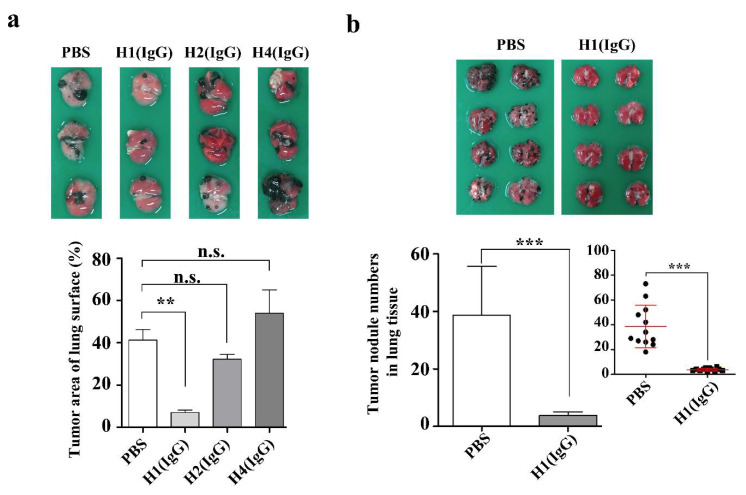
Figure 5.
Anti-metastatic effect of anti-hYKL-40 IgGs. (a) A plot comparing the inhibitory effects of H1 (IgG), H2 (IgG), and H4 (IgG) by the tumor area on lung tissue. (b) A plot revealing the inhibitory effect of H1 (IgG) by the number of tumor nodules on the lung tissue. The original plot, showing the mean value and the standard error of the mean (SEM) marked in red lines, is shown as the inlet. The closed circles indicate the individual lung tissues examined. ** p < 0.01, *** p < 0.001. n.s.: not significant.

