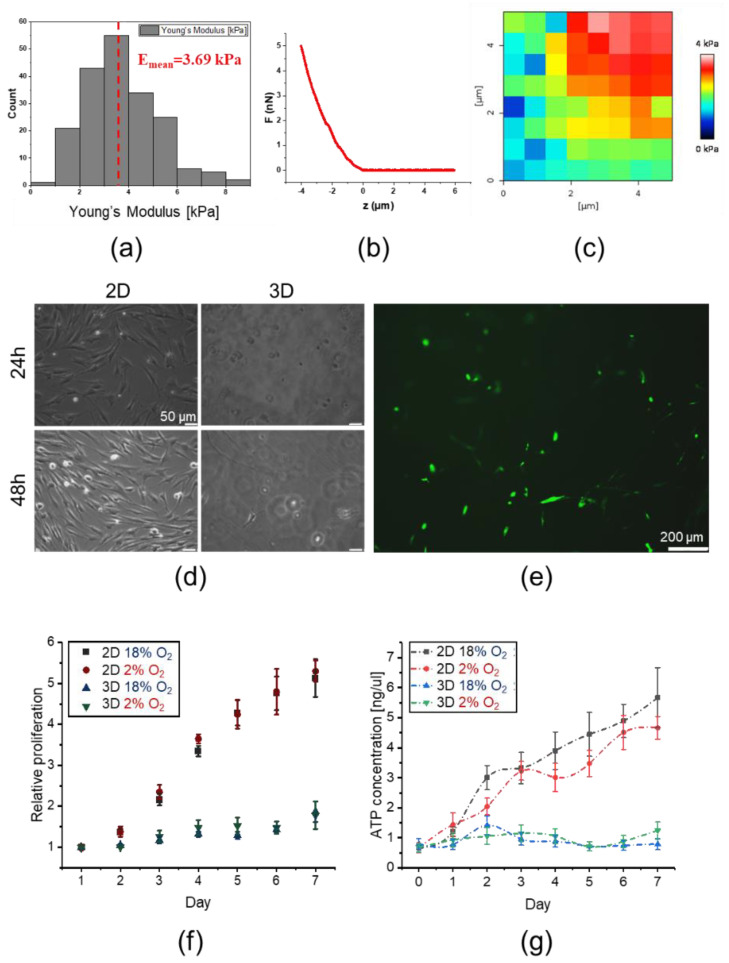
Figure 7.
Mechanical properties of the hydrogel matrix and their impact on morphology, proliferation, and metabolic activity of DPSCs. (a) Young’s modulus distributions of hydrogel matrix by AFM. (b) Exemplary force curve recorded on the hydrogel. (c) Exemplary elasticity map of peptide hydrogel. (d) Morphology of DPSCs encapsulated in hydrogel (3D) or seeded on the surfaces coated with gelatin (2D) at 24 and 48 h post-seeding. DPSCs were cultured in DMEM/F12 supplemented with 10% FBS and cultured under standard culture conditions (5% CO2, normoxia). (e) Morphology of DPSCs encapsulated in hydrogel (3D culture) on day 4 post-seeding. Cells were stained with fluorescein diacetate and analysed with Leica DMI6000B ver. AF7000 fluorescent microscope to visualize their morphology. (f) The proliferation of DPSCs in 2D and 3D cultures in the environment containing about 18% or 2% O2 analysed every 24 h until day 7. The analyses were conducted using the Cell Counting Kit-8. (g) Metabolic activity of DPSCs in 3D and 2D culture in the environment containing about 18% or 2% O2 measured every 24 h until day 7. The analyses were conducted using the ATP Lite Luminescence assay kit. The results from proliferation and metabolic activity are presented as mean ± SEM, n = 3 (every sample prepared for each DPSCs line from each donor was analysed in triplicate).

