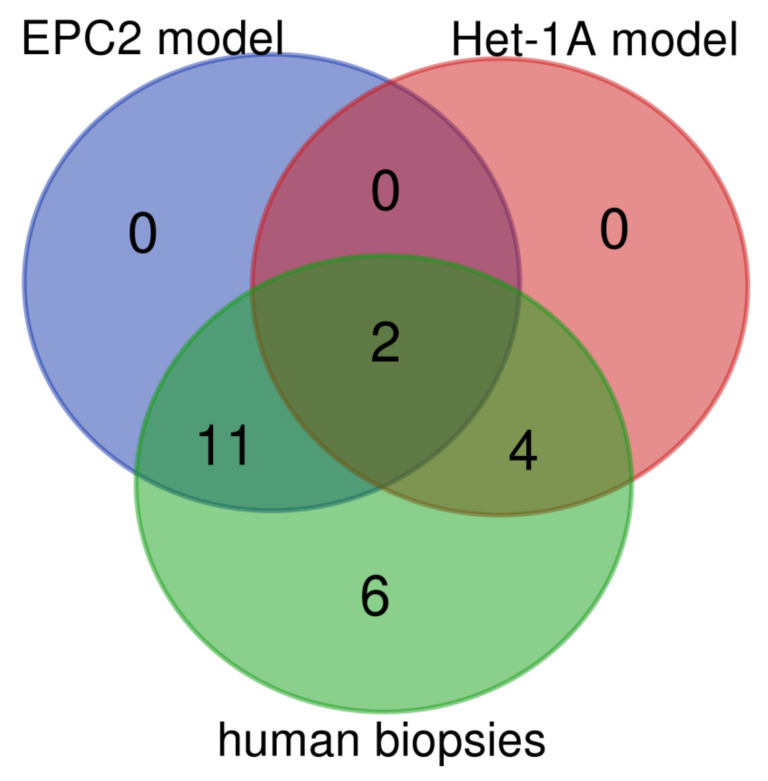
Figure 11.
Venn diagram displaying numbers of up/downregulated genes in human biopsies derived from patients with Barrett’s metaplasia as compared with in vitro Het-1A and EPC2 model of Barrett’s esophagus. Overlap area shows the number of the same up/downregulated genes in the appropriate groups. Graphs were obtained through Venn diagrams software (available online: http://bioinformatics.psb.ugent.be/webtools/Venn/). Different colors mean different datasets.

