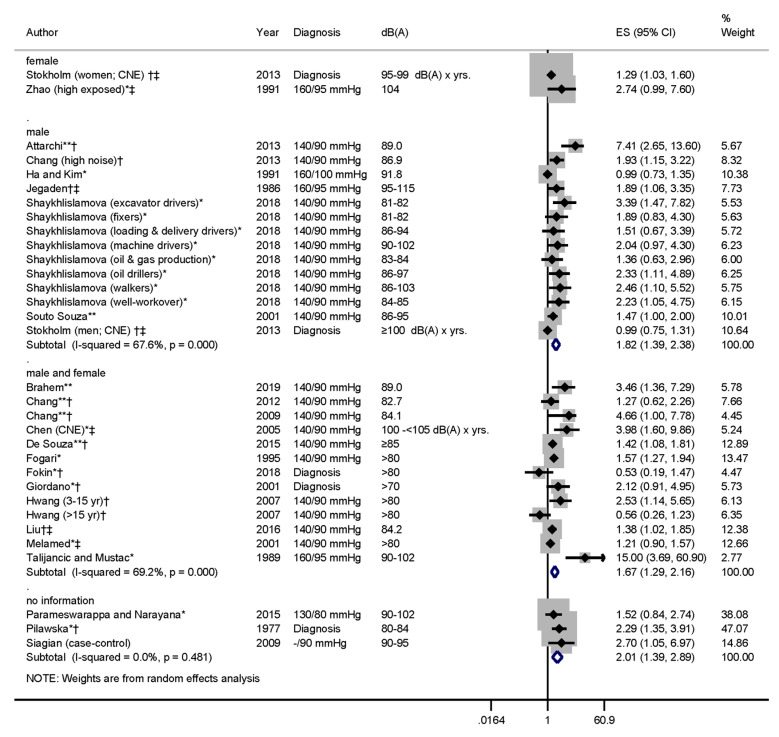
Figure 7.
Forest plot depicting study results stratified by sex. Studies marked with * indicate that we calculated the effect size (ES) from the reported prevalence. Studies marked with ** indicate that the odds ratio was corrected to represent the prevalence ratio. † indicates that a physician diagnosis of hypertension was included in hypertension definition, and ‡ indicates that anti-hypertensive use was included in the hypertension definition.

