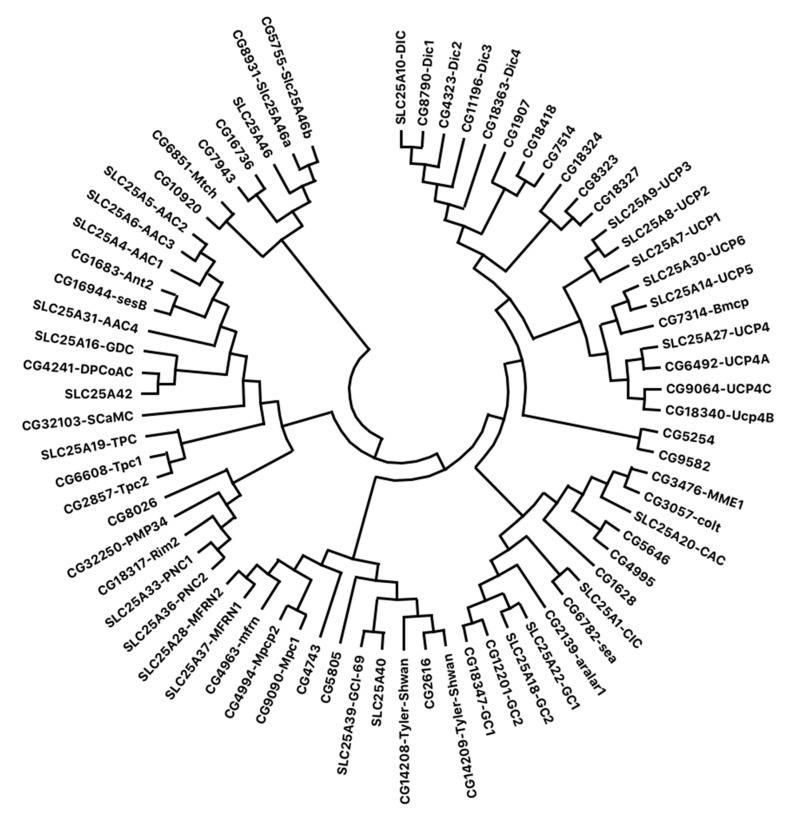
Figure 1.
Phylogenic tree of amino acid sequences of mitochondrial carriers from D. melanogaster and H. sapiens. For comparative purposes, the 48 members of Drosophila melanogaster (Supplemental Table S1) and the 25 human members reported in Table S1 were employed. Sequences were retrieved from the GenBank, EMBL and Flybase databases. The evolutionary history was inferred by the use of the Maximum Likelihood method and JTT matrix-based model [15]. The tree with the highest log likelihood (−49,468.35) is displayed. Initial tree(s) for the heuristic search were automatically obtained by applying Neighbor-Join and BioNJ algorithms to a matrix of pairwise distances estimated using the JTT model and then selecting the topology with a superior log likelihood value. The tree is drawn to scale, with branch lengths representing the number of substitutions per site. This analysis included 73 amino acid sequences. The final dataset comprised a total of 910 positions. Evolutionary analyses were performed in MEGA X [2,3].

