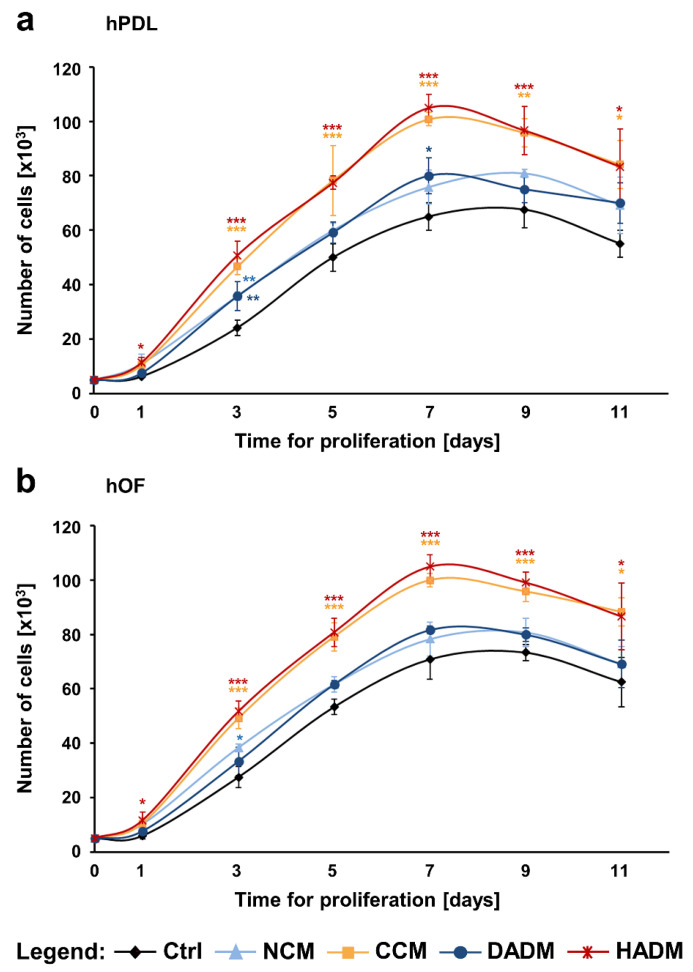
Figure 3.
Proliferation rates of primary hPDL (a) and hOF (b) cultured on tissue culture plastic (Ctrl) or on each of the four collagen matrices (NCM, CCM, DADM, and HADM) were assessed by trypan blue dye exclusion cell counting. The number of viable cells in each experimental group was determined on day 1, 3, 5, 7, 9, and 11. Data represent means ± SD from three independent experiments performed with three different cell donors for each of the two cell types. Significant differences to control cells at each individual time point, *** p < 0.001, ** p < 0.01, * p < 0.05.

