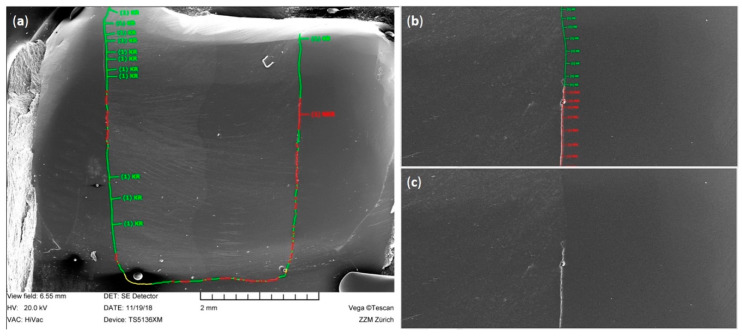
Figure 4.
Illustration of the quantitative SEM margin analysis performed in this study. (a) SEM image of the entire proximal margin with classified continuous (green), non-continuous (red), and not judgeable (yellow) margin segments; (b) detail of image (a) with classified margin segments at 200 × magnification; (c) same image as (b) without labeled margin segments.

