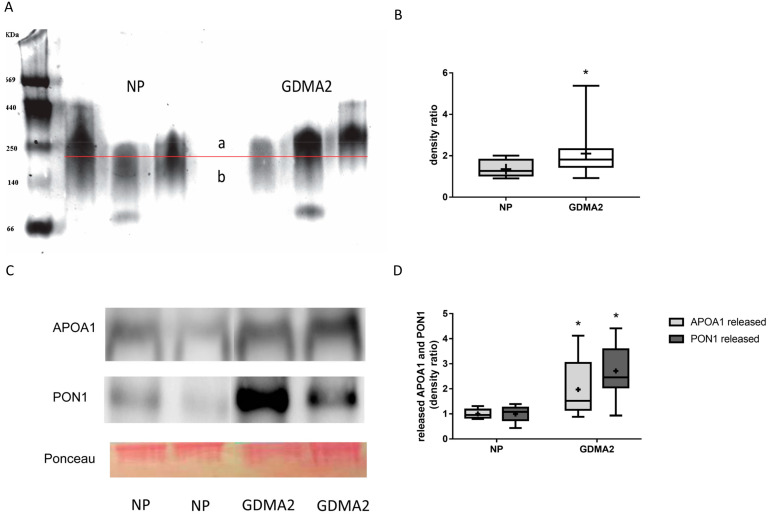
Figure 1.
HDL composition: APOA1 and PON1 expression. (A) HDL from normal pregnancy (NP) (control) and GDMA2 were separated from plasma and run on native 4–12% PAGE. Band intensities above (a) and below (b) the horizontal lines drawn in the middle of each control HDL band were analyzed. (B) The ratio a/b was calculated for GDMA2 HDL as compared to the NP HDL (box plot of data). (C) HDL from GDMA2 and NP run on nondenaturing 15% PAGE followed by western blot analysis using anti-APOA1 and anti-PON1 antibodies (optical densities were normalized to Ponceau general protein stain. (D) APOA1 and PON1 protein expression (densitometric analysis). Data are expressed as mean ± SD of HDL isolated from 10 women with NP and 20 with GDMA2. PAGE represents two independent experiments of NP and GDMA2 each. * p < 0.05 compared to NP. Box plots show the five-number summary of a set of data, including the minimum score, first (lower) quartile, median, third (upper) quartile and maximum score, “+” indicates the average.

