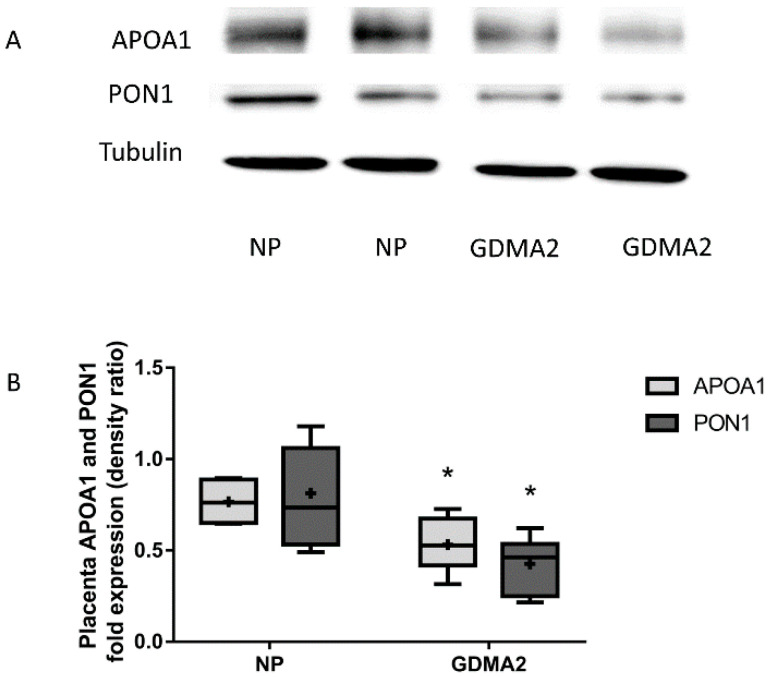
Figure 2.
APOA1 and PON1 protein expression in placental tissue. (A) Protein extracted from placenta tissue run on 10% PAGE-SDS followed by western blot analysis using anti-APOA1, anti-PON1 antibodies and Tubulin (B) APOA1 and PON1 protein expression (densitometric analysis). Optical densities were normalized to Tubulin. Data are expressed as mean ± SD of 10 NP placenta and 20 GDMA2 placenta tissues. * p < 0.05 compared to NP. PAGE-SDS represents two independent experiments of NP and GDMA2, each. Box plots show the five-number summary of a set of data, including the minimum score, first (lower) quartile, median, third (upper) quartile, and maximum score, “+” indicates the average.

