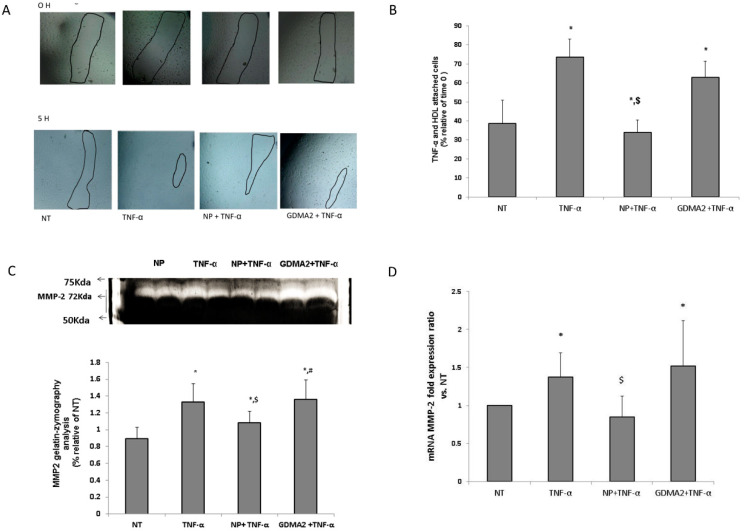
Figure 3.
HDL and endothelial cell migration: (A,B) HDL-GDM (100 µg/mL) and HDL-NP (100 µg/mL) were added to cells for 1 h and stimulated with TNF-α (1 ng/mL) for an additional 4 h, marked in figure as NT (nontreatment), NP + TNF-α and GDM + TNF-α. Results were normalized to time 0. * p < 0.05 compared to NT, $ p < 0.05 compared to TNF-α treatment. (C) After 5 h, supernatants were collected and MMPs activity was measured by gelatin zymography, relative analysis of MMP-2 results were normalized to NT. (D) MMP-2 mRNA fold expression ratio vs. NT. * p < 0.05 compared to NT, $ p < 0.05 compared to TNF-α treatment, # p < 0.05 compared to NP + TNF-α treatment. Representative figures of 4 independent experiments (HUVEC from 4 different donors) including 3 technical repeats for each experiment. HDLs from different donors were used for the migration assay.

