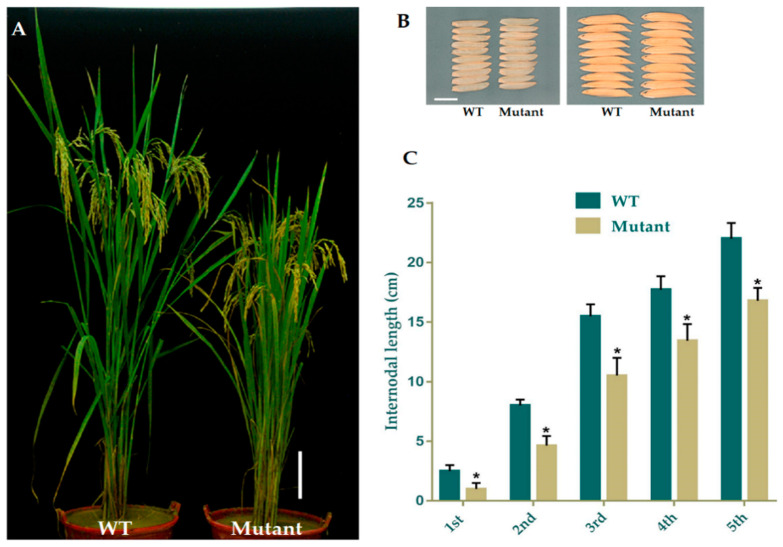
Figure 2.
Phenotypic appearance of OsGA20ox2 in GXU43_9 and WT. (A) Plant height of mutant lines and WT after the heading stage. Bar = 15 cm. (B) Grain phenotype of mutant line and WT; Bar = 5 mm. (C) The lengths of internodes in mutant line and WT. The “*” denotes the significant difference at p < 0.01. Values are means ± standard deviation (SD) (n = 10 plants).

