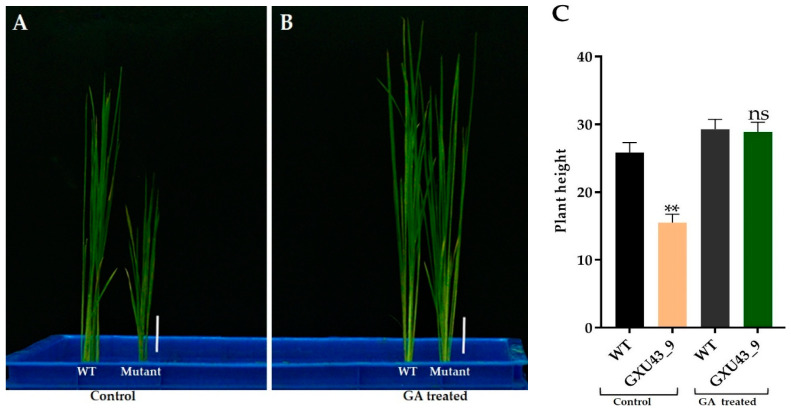
Figure 3.
The seedling phenotype of the homozygous mutant GXU43_9 and WT. (A) Seedlings phenotype without GA, (B) Seedlings treated with GA, and (C) PH (plant height)of GA3-treated and control (n = 15), Bars = 3 cm. Data are mean ± SD. “**” and “ns” represent a significant and non-significant difference respectively at p ≤ 0.01.

