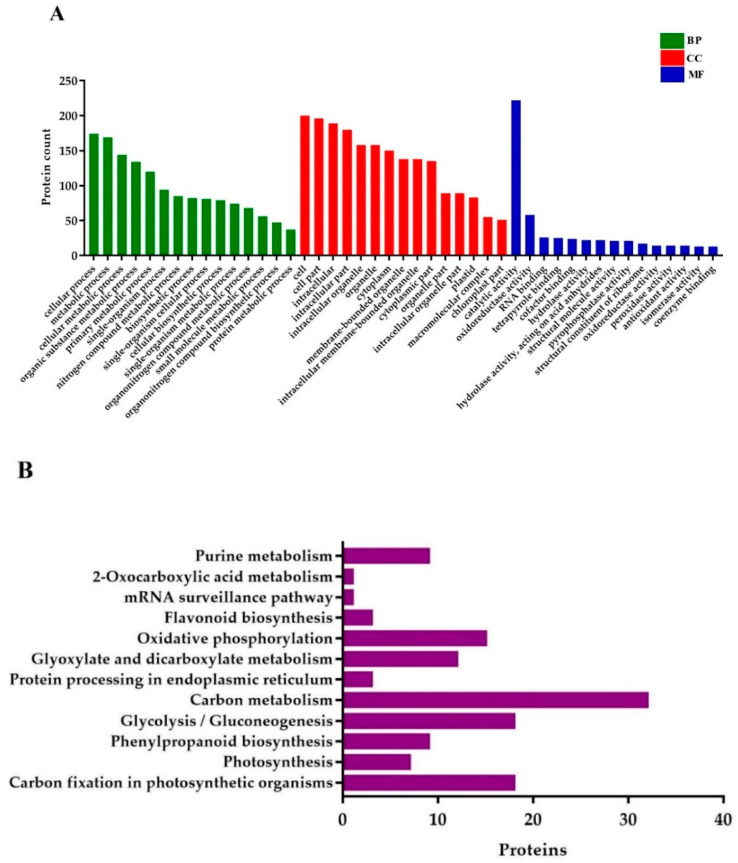
Figure 7.
Gene ontology (GO) and KEGG (Kyoto Encyclopedia of Genes and Genomes) pathway enrichment analysis of DEPs. (A) GO annotations of the DEPs, and (B) the histogram of KEGG pathway enrichment, with the bar showing the number of proteins. BP; biological processes, CC; cellular components, and MF; molecular functions.

