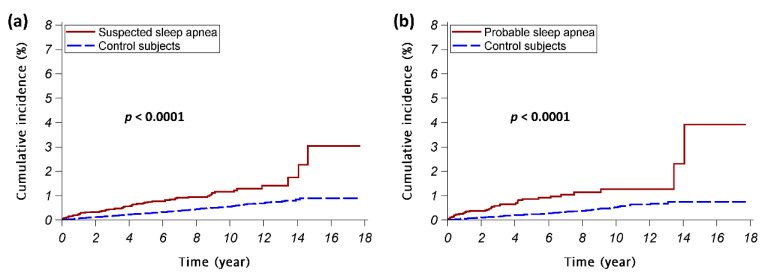
Figure 2.
The cumulative incidences of temporomandibular disorder. The red continuous lines show the cumulative incidence of temporomandibular disorder for the sleep apnea patients; the blue dashed lines show the cumulative incidence of temporomandibular disorder for the control subjects. (a) Study arm A (the suspected sleep apnea cohort vs. control A cohort); (b) Study arm B (the probable sleep apnea cohort vs. control B cohort).

