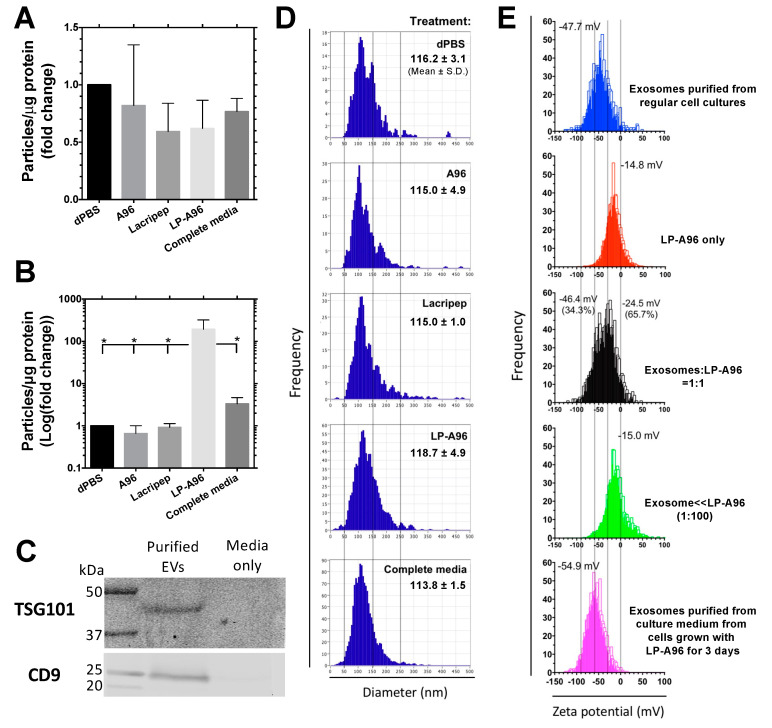
Figure 3.
LP-A96 activates exosome biogenesis in corneal epithelial cells. (A) Nanoparticle tracking analysis was used to quantify extracellular vesicles (EVs) in the collected HCE-T cell culture media under each treatment at near maximum confluency. Cells cultured to 80~90% confluency were starved for another 24 h using basal media prior to the treatment. EVs in the culture media were purified after 3 days of treatment. (B) EVs in the collected HCE-T cell culture media under each treatment at subconfluency (30%). Cells were supplemented with different agents upon seeding (0.5 × 10⁵ cells/well in 12-well plate). EVs in the culture media were purified after 3 days of seeding. The raw increase in EV amount upon LP-A96 treatment was corrected based on the Western blot-based analysis (Appendix A Figure A2) before being analyzed for fold change. For (A,B), all treatments were at 1 μM. (C) EVs collected after LP-A96 treatment were enriched in the exosome markers CD9 and TSG101. (D) Bar graphs show the size distribution of purified exosomes. The three parallel gray lines indicate 50, 150, and 250 nm, respectively. Representative data from three independent sets of the experiment is shown. Inserted numbers indicate mean hydrodynamic diameter of purified exosomes. (E) Zeta potential analyses of exosomes, LP-A96, and combinations of both at different ratios. The four parallel gray lines indicate −90, −60, −30, and 0 mV, respectively. Inset values are the mean zeta potentials reported by the built-in software. A one-way ANOVA followed by multiple comparisons was used for statistical comparison. * p < 0.05. Mean ± SD.

