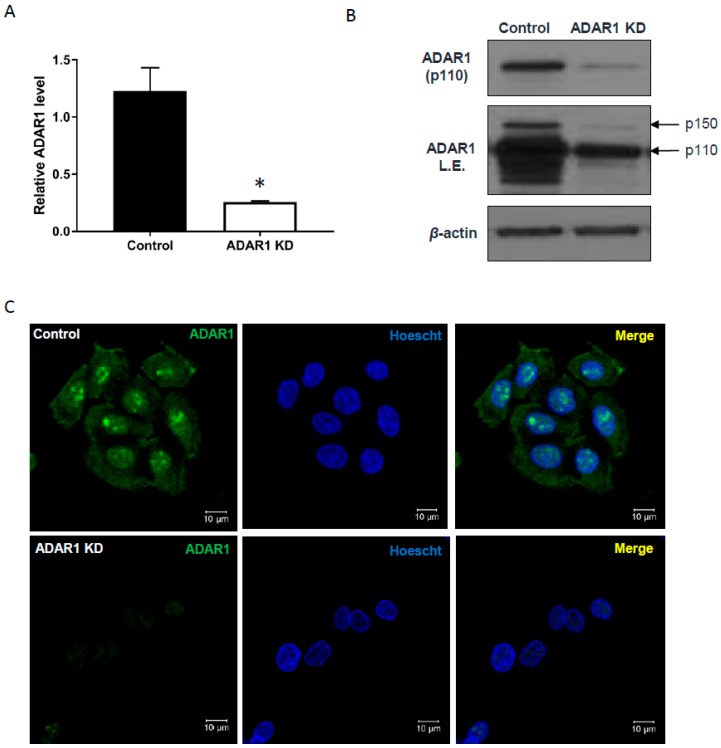
Figure 1.
Inducible knockdown of ADAR1 in AGS gastric cancer cells. (A) qRT-PCR, (B) immunoblot, and (C) immunofluorescence analysis of ADAR1 expression in AGS cells infected with Tet-on shADAR1 or control (empty vector). In (C), green signal on the left indicates ADAR1 protein and the middle one is for Hoechst staining. Merged image is shown on right. Scale bar, 10 µM; * p < 0.05.

