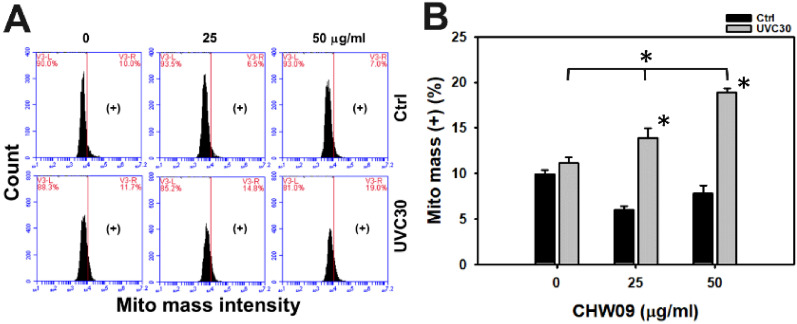
Figure 7.
Changes of Mito mass of UVC and/or CHW09 treatments in oral cancer Ca9-22 cells. Cells were pretreated with UVC irradiation (0 and 30 J/m2) and/or post-treated with CHW09 (control, 25, 50 µg/mL) for 24 h. (A) Representative pattern of mito mass analysis for UVC and/or CHW09 treatment. (+) in the right side of each panel indicates the mito mass (+) (%). (B) Statistics in Figure 7A. Data, mean ± SD (n = 3 independent experiments). For multiple comparison, significance of the difference was examined by one-way ANOVA and the Tukey HSD Post Hoc Test. *, p < 0.0001. * without line indicates the significance between control and UVC30. * with line indicates the significance between UVC30/CHW09 and others.

