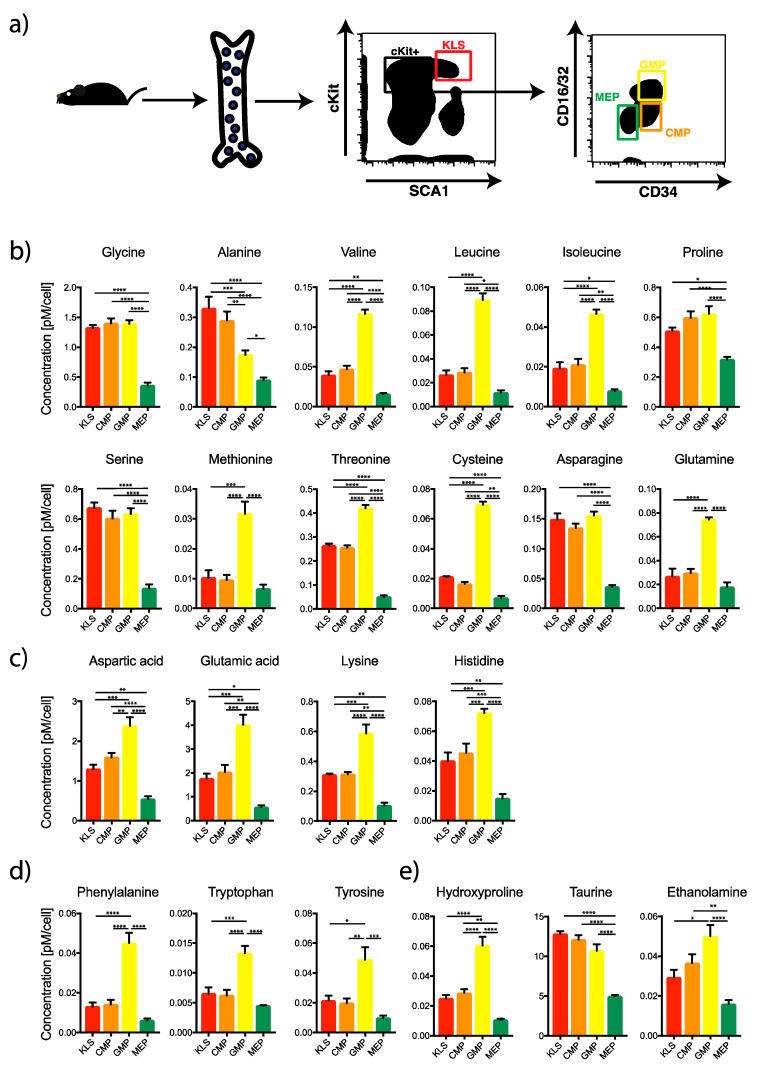
Figure 1.
Estimation of amino acid content in various bone marrow populations. (a) Different populations from the mouse BM were FACS sorted for amino acid analysis. KLS: Lin−1cKit+Sca1+; CMP: Common Myeloid Progenitor; GMP: Granulocyte Macrophage Progenitor; MEP: Megakaryocyte Erythroid Progenitor. (b–e) Measurement of amino acid content in different populations. One-way ANOVA * p < 0.05, ** p < 0.01, *** p < 0.001, **** p < 0.0001 (n = 3).

