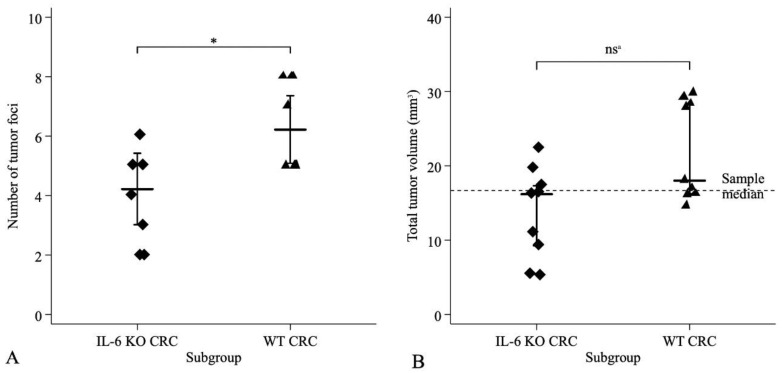
Figure 1.
Distribution of (A) tumor foci and (B) total tumor volume (TTV) in IL-6 KO CRC model and WT CRC model groups. Total number in both groups was n = 9. A—number of tumor foci with two-sided Student–test; B—TTV with nonparametric tests. * Two-Sided Student’s t-test: t16 = −2.79, p = 0.013. nsa (a not significant) Kolmogorov-Smirnov test exact p = 0.352, Mann-Whitney test p = 0.058, non-parametric equality of medians test exact p = 0.347.

