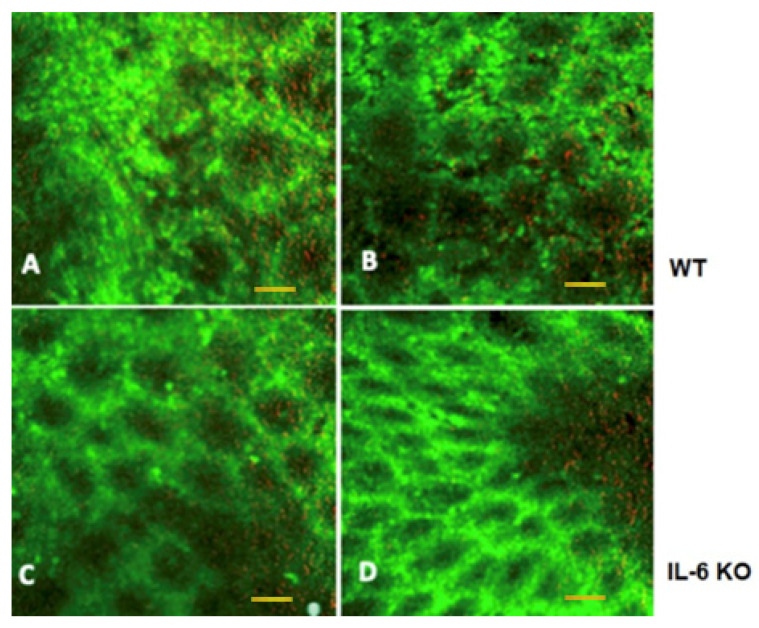
Figure 6.
Intraluminal fluorescent endomicroscopic images of WT and IL-6 KO mouse colon. (A) In vivo intraluminal image; (B) ex vivo mucosal surface image in a WT mouse with colonic tumor; (C) in vivo intraluminal image; (D) ex vivo mucosal surface image in an IL-6 knockout mouse with inflammation-related colonic neoplasia. 488 nm (green) and 660 nm (red) dual band fluorescent Cellvizio endomicroscopic images. Scale bar represent 50 microns for all images.

