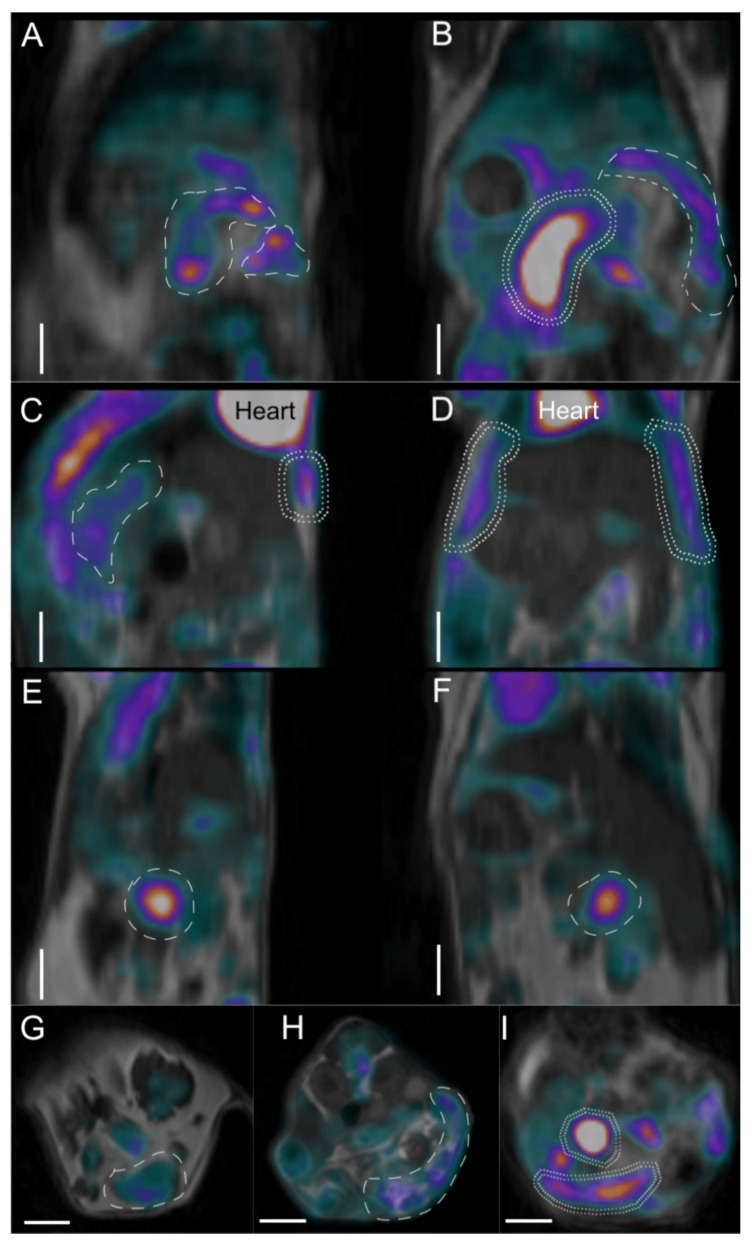
Figure 7.
Positron emission tomograph (PET)/magnetic resonance imaging (MRI) imaging of WT (A,B,I) and IL-6 KO (C–H) mouse abdominal regions in three section planes. (A) Sagittal planes of WT mouse; (B) horizontal section of WT mouse; (C,E) sagittal planes of IL-6 KO mice; (D,F) horizontal planes of IL-6 KO mice; (G,H) cross-sections of IL-6 KO mice; (I) cross-section of WT mouse abdomen. High [18F]-fluoro-deoxy-d-glucose (FDG) activity uptake regions (over 0.2 standardized uptake values (SUV values) are circumscribed with dashed lines. Double-dashed line shows very high (over 0.4 SUV value) FDG uptake regions. Color scales are grayscale for the background anatomic MRI images, while the PET component shows low uptake in black (no uptake) to blue (low uptake), moderate in purple to red and higher FDG uptake in red through yellow to white (highest uptake). Heart is annotated in panels C and D for reference. White scale bars in each panel equal 500 microns.

