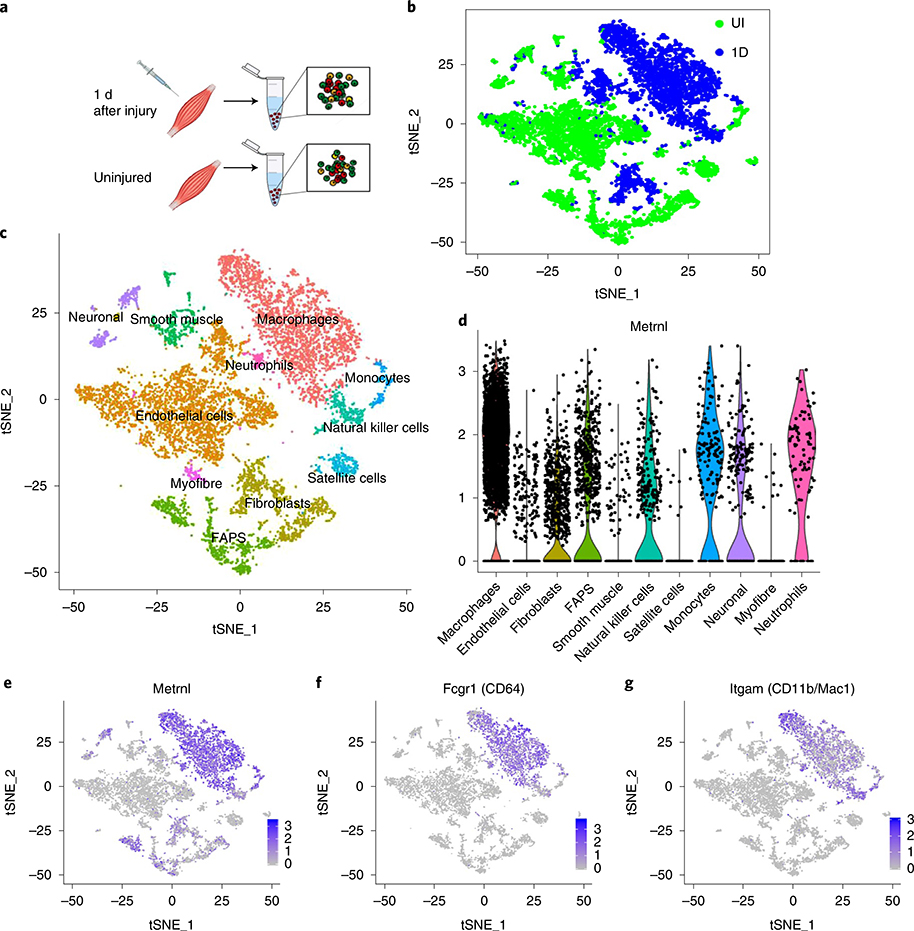
Fig. 4 |. Metrnl gene expression after injury is identified in macrophage populations.
a, Single-cell RNA-seq analysis of uninjured and injured muscle (1 d after injury). b, Batch plot showing cell populations present in uninjured (green) and injured (blue) groups (n = 1 per group). c, The t-distributed stochastic neighbour embedding (tSNE) plots showing various cell populations in the uninjured and injured muscle (n = 1 per group). d, Violin plot of Metrnl expression throughout the identified cell clusters. Each dot represents individual cells and their relative gene expression. FAPS, fibro-/adipogenic progenitors. e–g, Gene expression plots of Metrnl (e), CD64 (f) and CD11b (g) (n = 1 per group).

