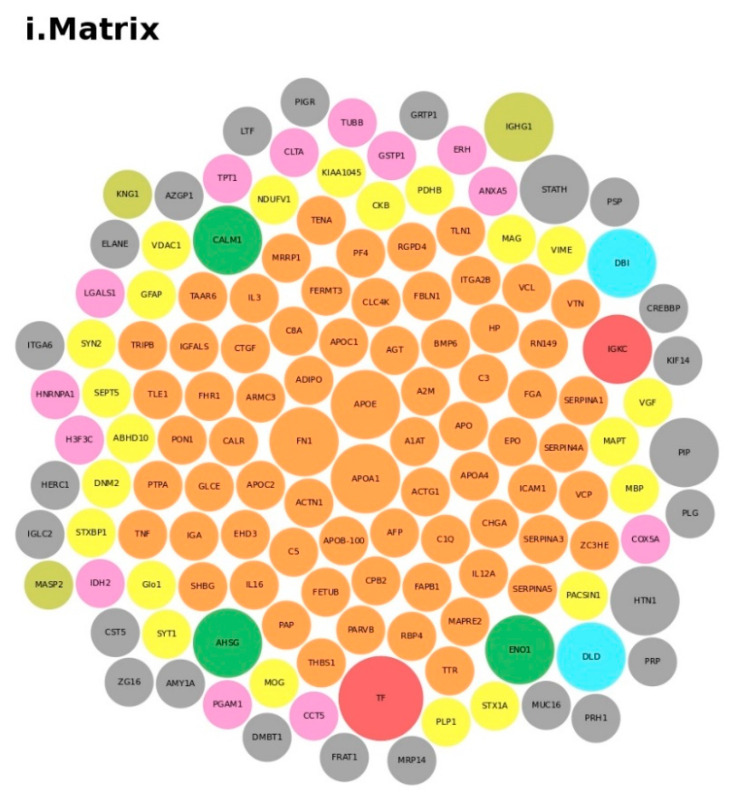
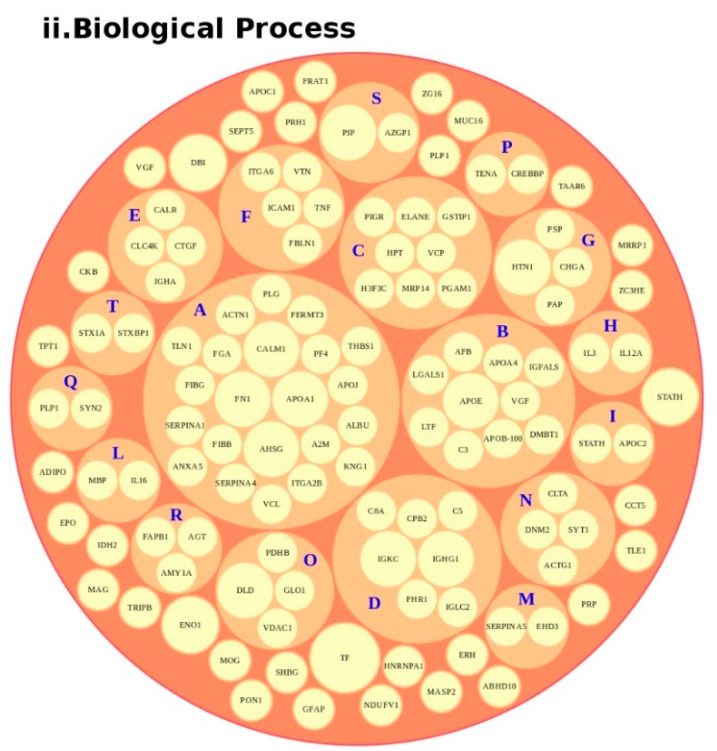
Figure 4.
Protein analysis as a tool for the decision support system (DSS). In box (i), we grouped the proteins highlighted in Table 1 and Table S1 according to the matrix in which the proteins were studied, such as blood (orange), blood and urine (lawn green), brain (red), dried blood (brown), urine (pink), and brain biopsies, urine and blood (lilac). The size of the bubbles indicates the number of times the protein was found in that matrix in the different studies taken into consideration. In box (ii), we analyzed the data for the biological process and clustered the protein. Legend code: (A) platelet degranulation (GO:0002576); (B) cellular protein metabolic process (GO:0044267); (C) neutrophil degranulation (GO:0043312); (D) regulation of complement activation (GO:0030449); (E) receptor-mediated endocytosis (GO:0006898); (F) extracellular matrix organization (GO:0030198); (G) antimicrobial humoral response (GO:0019730); (H) cytokine-mediated signaling pathway (GO:0019221); (I) retinoid metabolic process (GO:0001523); (L) immune response (GO:0006955); (M) blood coagulation (GO:0007596); (N) membrane organization (GO:0061024); (O) pyruvate metabolic process (GO:0006090); (P) signal transduction (GO:0007165); (Q) chemical synaptic transmission (GO:0007268); (R) regulation of lipid metabolic process (GO:0019216); (S) transmembrane transport (GO:0055085); (T) glutamate secretion (GO:0014047).


