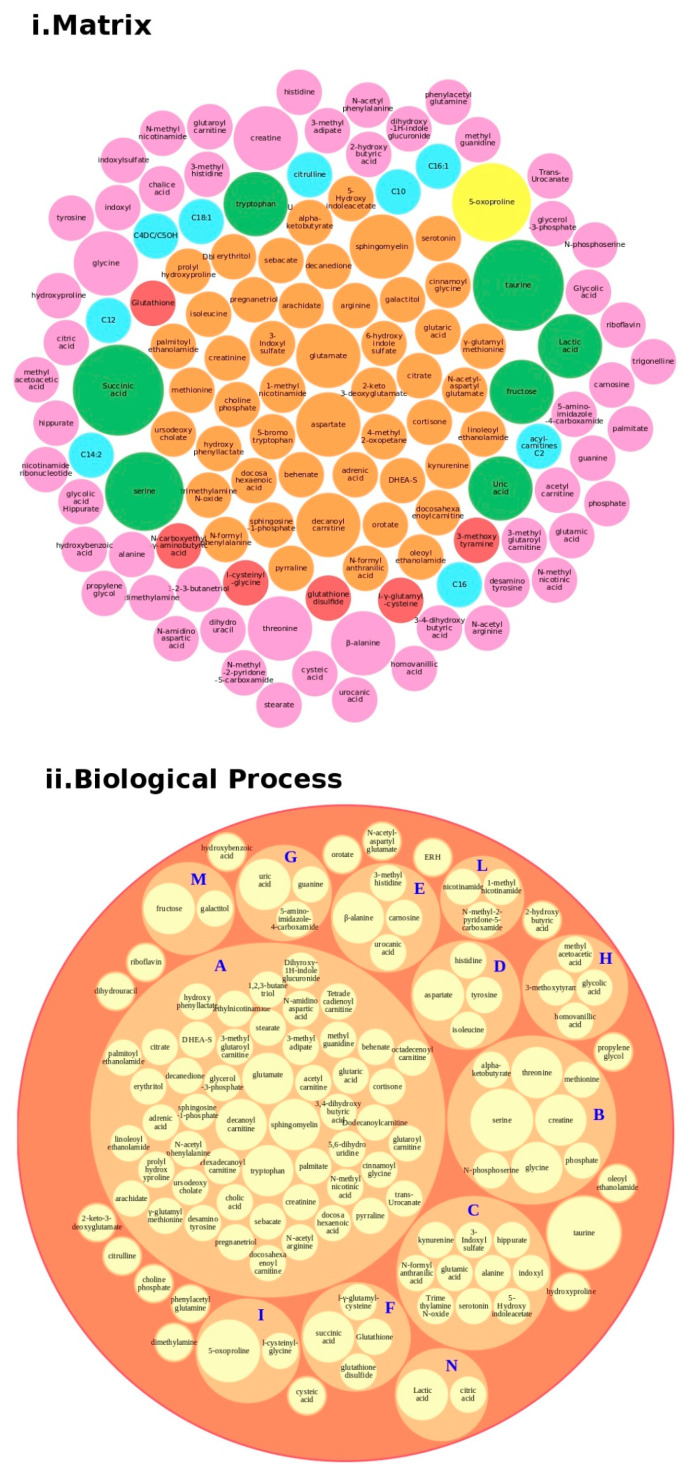
Figure 5.
Metabolites analysis as a tool for the decision support system (DSS). In box (i), we grouped the metabolites highlighted in Table 2 and Table S1 according to the matrix in which the metabolites were studied, such as blood (orange), blood and urine (lawn green), brain (red), dried blood (brown), urine (pink), and brain, urine and blood (lilac). The size of the bubbles indicates the number of times the metabolites were found in that matrix in the different studies taken into consideration. We analyzed the data for the biological process (box (ii) and clustered the metabolites. Legend code: A: Lipid Metabolism Pathway; B: Glycine and Serine Metabolism; C: Tryptophan Metabolism; D: Transcription/Translation; E: Histidine Metabolism; F: Glutamate Metabolism; G: Thioguanine Action Pathway; H: Tyrosine Metabolism; I: Glutathione Metabolism; L: Nicotinate and Nicotinamide Metabolism; M: Galactose metabolism; N: Glutaminolysis and Cancer.

