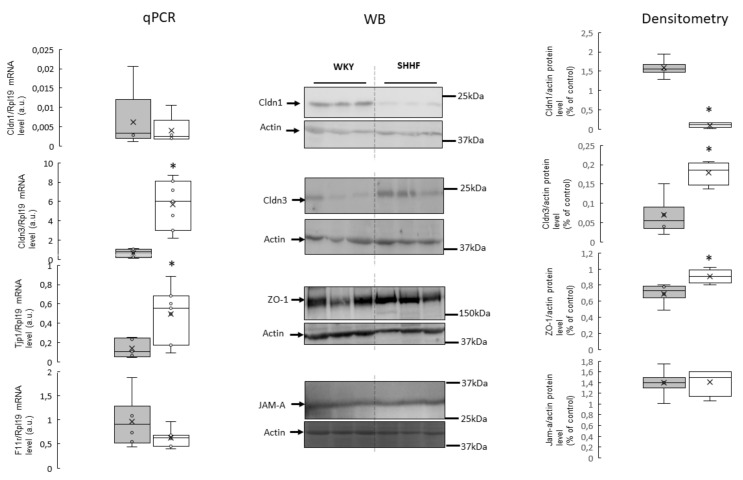
Figure 3.
RT-qPCR analysis of claudin 1 (Cldn1), claudin 3 (Cldn3), zonula occludens-1 (ZO-1), and F11r transcript levels in the colon of WKY and SHHF rats (displays on histogram use arbitrary units), (means ± SD, n = 6–7). Western blot analysis of Cldn1, Cldn3, ZO-1 and junctional adhesion molecule A (JAM-A) protein levels from total protein extract prepared from the colon. A representative immunoblot is shown. Immunolabeled Cldn1, Cldn3, ZO-1, JAM-A and beta actin loading control bands were quantified using a Molecular Imager. The relative levels of the test proteins are plotted in arbitrary unit (means ± SD), grey bars—Wistar Kyoto rats, white bars—spontaneously hypertensive heart failure rats, * p < 0.05 by t-test.

