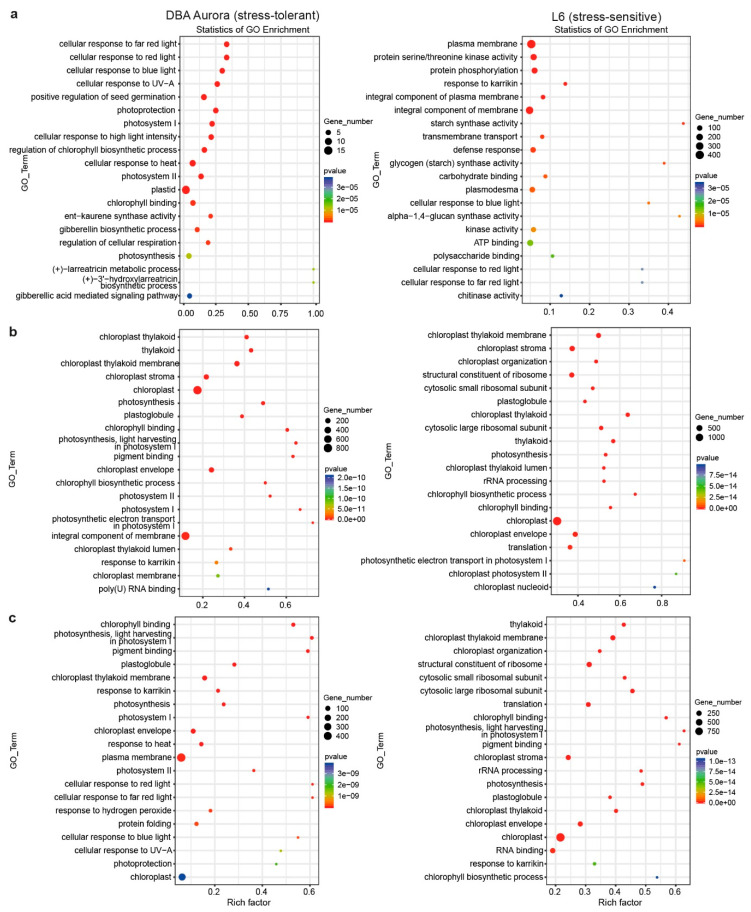
Figure 2.
Gene ontology (GO) enrichment analysis of stress-responsive DEGs (differentially expressed genes, p < 0.05) under stress. (a) In response to water-deficit stress. (b) In response to heat stress. (c) In response to water-deficit plus heat stress. GO terms on the Y-axis are ranked by p-value in the enrichment analysis. Rich factor stands for the ratio of DEG number to the total number of genes that have been annotated under this GO term (i.e., the degree of enrichment).

