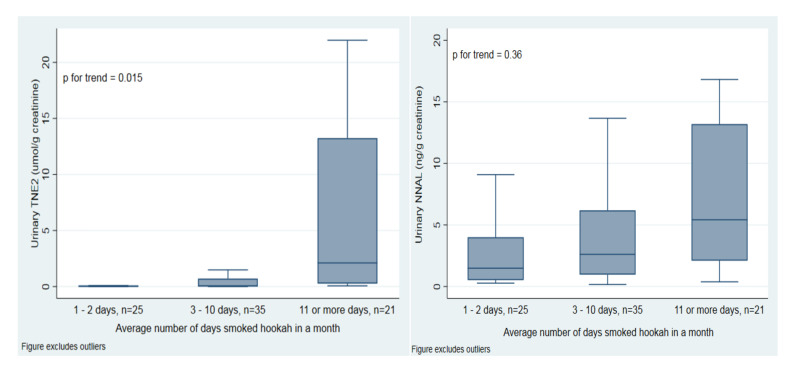
Figure 1.
Weighted urinary TNE-2 and NNAL concentrations by average number of times smoked hookah in a month among past 30-day exclusive, established hookah users. Horizontal lines within boxes represent median values. The bottom and top of the boxes are the 25th and 75th percentiles. The distance between the top and bottom boxes represents the interquartile range (IQR). Top and bottom horizontal bars are the maximum and the minimum without outliers. Outliers have been excluded from the figures but remain in the analysis.

