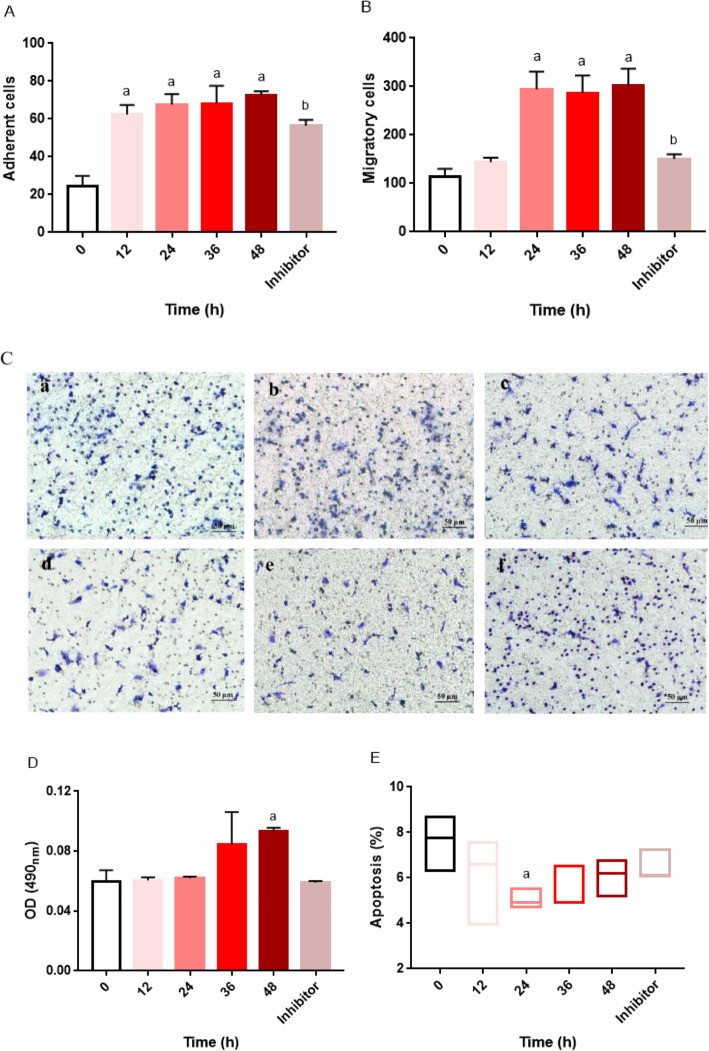
Fig. 3.
Time-dependent effects of chemerin on the biological characteristic of EPCs. The control group was not subjected to any drug treatment; the control group received only the same volume of solvent used for the drug treatments in the treatment groups. The chemerin treatment groups included 12 h, 24 h, 36 h and 48 h protein-stimulated groups. EPCs were treated with chemerin at a concentration of 50 ng/mL. The inhibitor group was stimulated with 50 ng/mL chemerin protein plus 10 μmol/mL SB 203580 for 24 h. a Adherence of EPCs, a: VS. the control group, P < 0.05; b: the 24 h group VS. the inhibitor group, P < 0.05. The data are presented as the means ± SD. b Migration of EPCs, a: VS. the control group, P < 0.05; b: the 24 h group VS. the inhibitor group, P < 0.05. The data are presented as the means ± SD. c Image of EPC migration, a: the control group, b: the 12 h group, c: the 24 h group, d: the 36 h group, e: the 48 h group and f: the inhibitor group. d Proliferation of EPCs. The data are presented as the means ± SD. e Apoptosis ratio of EPCs. The data are presented as the median (range). All experiments involving cell culture studies were repeated three times, with three replicates per experiment

