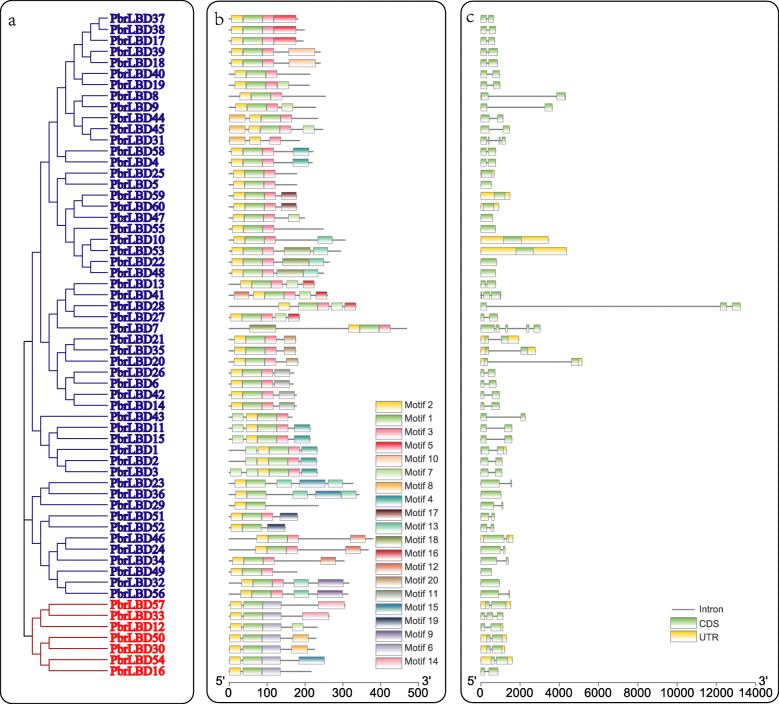
Fig. 2.
The phylogenetic relationship, conserved motifs and gene structure of PbrLBD proteins. (a) A phylogenetic tree of PbrLBD protein family was constructed by Mega-X using the Neighbor–Joining (NJ) method and 1000 bootstraps. The blue branches indicate class I; the red branches indicate class II. (b) The distribution of conserved motifs across 60 PbrLBD protein. A total of 20 motifs were predicted using MEME (Multiple Em for Motif Elicitation) tool in our study. The scale bar indicates 100 aa. (c) The gene structure of PbrLBD genes, including intron, exon, UTR. The black line indicates intron; the green rectangle indicates exon; the yellow rectangle UTR. The scale bar indicates 2 kb

