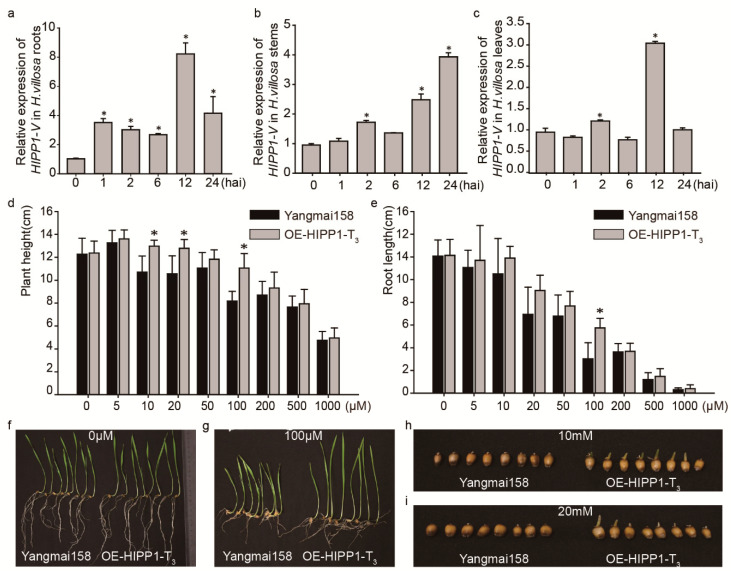
Figure 6.
Tolerance of HIPP1-V transgenic plants to Cd. Time-course expression profiling of HIPP1-V of H. villosa in response to Cd treatment in the roots (a), stems (b), and leaves (c). (d) The plant height between OE-HIPP1-T3 and Yangmai158 plants exposed to different Cd concentrations. (e) The root length between OE-HIPP1-T3 and Yangmai158 plants in different Cd concentrations. (f–i) OE-HIPP1-T3 and Yangmai158 phenotypes under treatments of different Cd concentrations (0, 100 μM, 10 mM, and 20 mM). *p < 0.05. hai: hours after induction.

