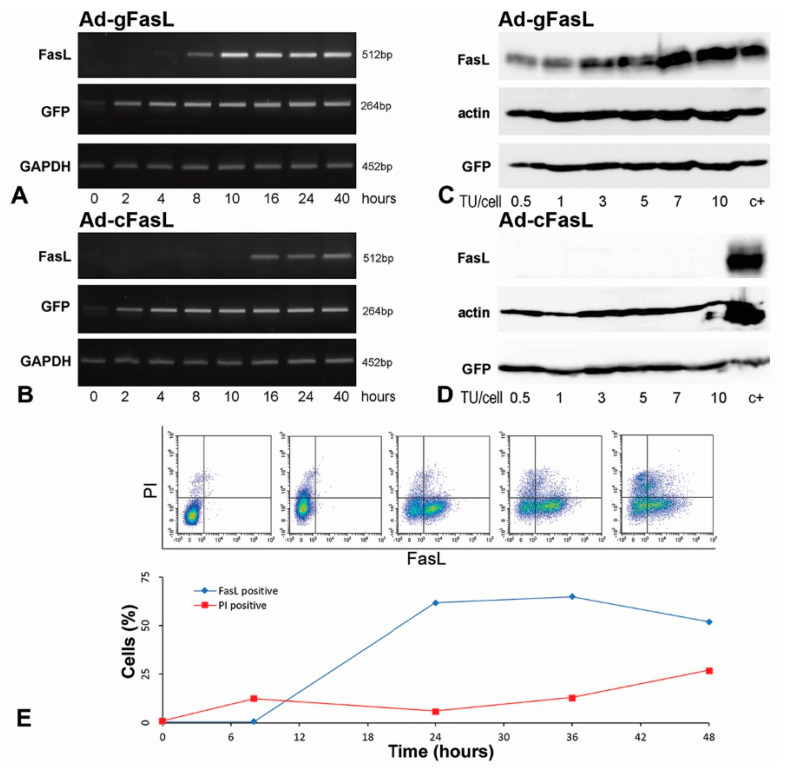
Figure 2.
Kinetics of FasL expression in transduced cells: (A,B) Hepa 1–6 hepatocytes were transduced with 5 transfection units (TU)/cell adenovirus carrying (A) FasL minigene (Ad-gFasL) and (B) cDNA (Ad-cFasL). FasL expression was assessed as a function of time after transduction by RT-PCR. Cells infected with Ad-gFasL displayed FasL expression after 8 h, with significant increased FasL level after 10 h (A). The expression of FasL in cells transduced with Ad-cFasL was very low, with delayed onset at 16 h (B). In parallel, expression of mRNA encoding GFP and GAPDH were followed. (C,D) Western blots performed at 40 h after transfection with Ad-gFasL (C) and Ad-cFasL (D) showed FasL protein expression commensurate with mRNA levels and stable GFP expression under all experimental conditions. Hepa 1–6 cells transfected with the pAdTrack-FasL minigene were used as a positive control (c+) in (C,D). The timecourse of the FasL expression on the membrane of transduced Hepa 1–6 cells was also determined by flow cytometry (E). The upper graphs (presented in E) represent the evolution in time of the cell population expressing FasL. Quantification of the flow cytometry experiments is represented in the plot (E, below). FasL is expressed on the cell surface (FasL positive, blue line), reaching approximately 61% at 24 h. However, cell death revealed using propidium iodide (PI positive, red line) increased in time, reaching approximately 25% at 48 h.

