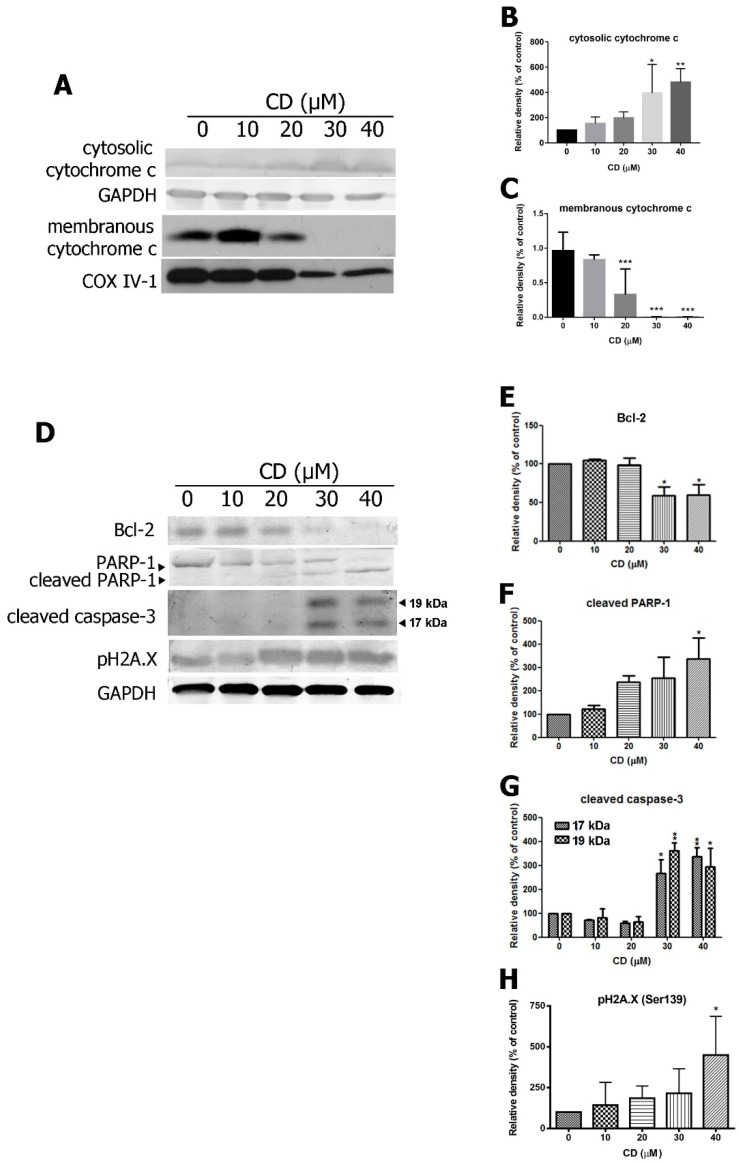
Figure 5.
Effects of CD on pro-apoptotic and anti-apoptotic proteins in T24 BC cells. (A) The expression of cytochrome c in the cytosolic fraction and membrane fractions. Glyceraldehyde 3 phosphate dehydrogenase (GAPDH) and cytochrome oxidase subunit IV isoform 1 (COX IV-1) were used as internal controls. (B,C) Quantifications of protein expression. (D) The expression of Bcl-2, cleaved PARP-1, 17 kDa, and 19 kDa subunits of cleavage caspase-3 and pH2A.X. (E–H) Quantifications of the protein expression. Bar graphs show normalised values as percentages relative to the control. Data are expressed as mean ± SD of three to five independent experiments. * p < 0.05, ** p < 0.01, *** p < 0.001 compared with the control group (0 µM).

