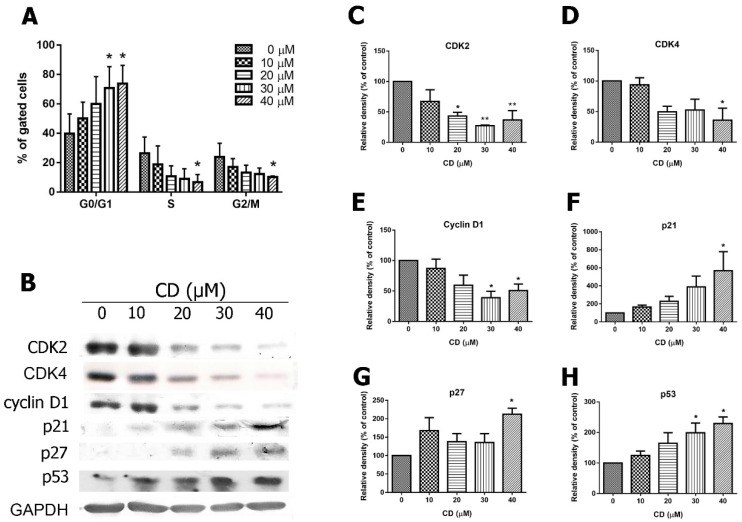
Figure 6.
Effects of CD on cell cycle distribution and cell cycle-related protein expression. Cells were treated with the indicated concentrations of CD for 24 h. (A) Quantification data of flow cytometry staining with PI. (B) Protein expression of p21, p27Kip1, p53, CDK2, CDK4, and cyclin D1. (C–H) Quantification results of each protein. Bar graphs show values normalised as percentages relative to the control. Data are expressed as mean ± SD of three to four independent experiments. * p < 0.05, ** p < 0.01 as compared with the control group (0 µM).

